Explain the core mechanics of selected algorithms, including regularization in linear models, distance-based prediction (k-NN), recursive partitioning (decision trees), ensemble learning (random forests), and margin maximization (SVMs).
Explain how model-specific mechanisms constrain complexity and reduce overfitting, including regularization, tree depth, ensemble averaging, and margin control in SVMs.
Select and justify an appropriate modeling approach for a given predictive task, considering data characteristics, performance metrics, and the trade-off between interpretability and predictive power.
Models for classification vs. regression
Machine learning models can often handle both classification (predicting categories) and regression (predicting numeric values):
Model family
Classification
Regression
Linear models
Logistic regression (Ridge/Lasso)
Linear regression (Ridge/Lasso)
Distance-based models
k-NN (classification)
k-NN (regression)
Tree-based models
Decision trees, random forest
Regression trees, random forest
Margin-based models
Support vector machine (SVC)
Support vector regression (SVR)
Neural networks
Neural networks (classification)
Neural networks (regression)
Which model should we choose for a given predictive task? → depends on:
prediction task (classification vs regression)
data structure
complexity of relationships
need for interpretability vs. performance
Linear models
Regularization
Linear models are simple and interpretable—but they can still overfit.
Especially problematic when:
many features (high-dimensional data)
features are correlated or redundant
noise is present in the data
Without constraints:
the model fits the training data very well
but performs poorly on new data (low generalization)
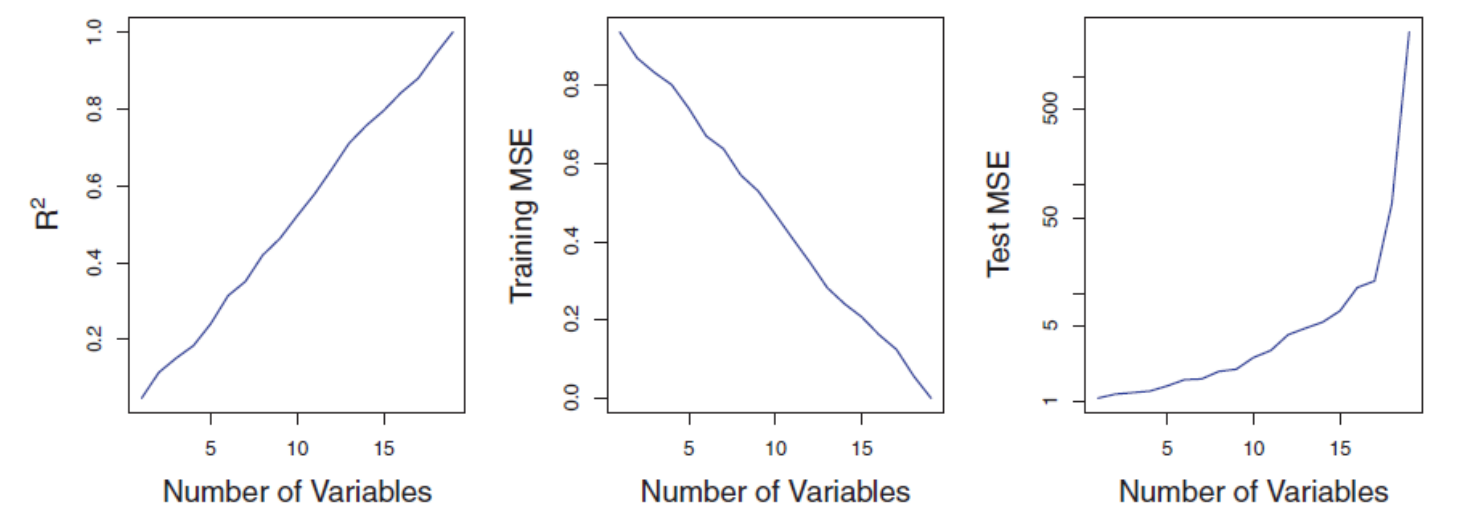
High dimensionality in linear regression (I)
The figure illustrates the risk of applying OLS when the number of features \(p\) is large. The model’s \(R^2\) increases to 1 as the number of features increases, and the training set MSE decreases to 0. At the same time, the MSE on a test set becomes extremely large as the number of features increases.
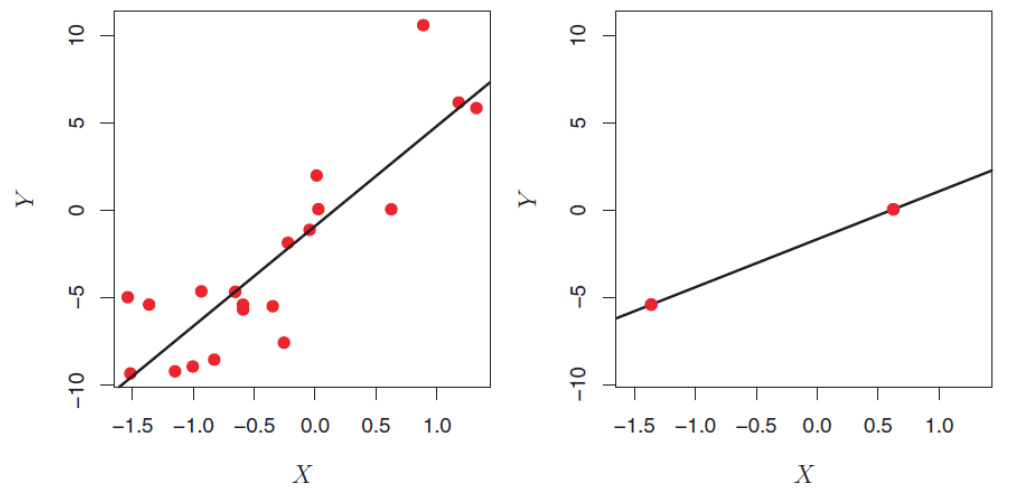
High dimensionality in linear regression (II)
OLS is not suitable for high-dimensional data. Especially when the number of features p is as large as, or larger than, the number of observations, OLS cannot be applied. Regardless of whether there truly is a relationship between the features and the response, OLS will yield a set of coefficient estimates that result in a perfect fit to the data, such that the residuals are zero.
The figure shows two cases. When there are 20 observations, n > p and the OLS line does not perfectly fit the data. When there are only two observations, then regardless of the values of those observations, the regression line will fit the data exactly. This is problematic because this perfect fit will almost certainly lead to overfitting of the data.
Regularization
Core idea of regularization: Prefer simpler models that fit the data well enough:
Lasso (L1): shrinks and sets some coefficients exactly to zero
Key takeaway
Good models balance fit and simplicity → Regularization helps control complexity and improve generalization
Ridge regression
Ridge regression is an enhancement of OLS using a technique that constrains or regularizes the coefficient estimates. This is done by shrinking the coefficient estimates towards zero resulting in a gain in robustness and a higher generalization ability.
Similar to OLS, ridge regression estimates the parameters of the function
\[y_i = \beta_0 + \beta' x_i + v_i\]
but instead of minimizing the residual sum of squares (\(v^2\)), the function to minimize is
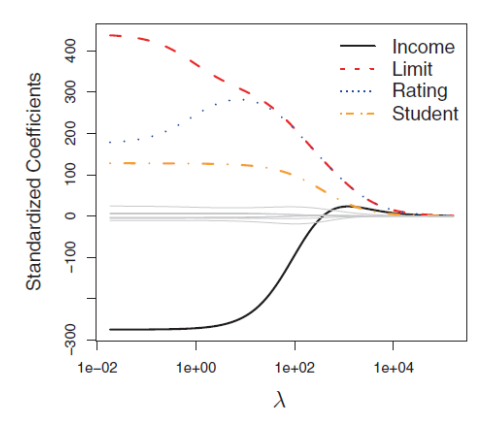
where \(\lambda \geq 0\) is a tuning parameter, to be determined separately. It is called a shrinkage penalty and has the effect of shrinking the estimates of \(\beta_j\) towards zero. This is equivalent to reducing complexity.
\(\lambda\) is not applied to the intercept \(\beta_0\) !
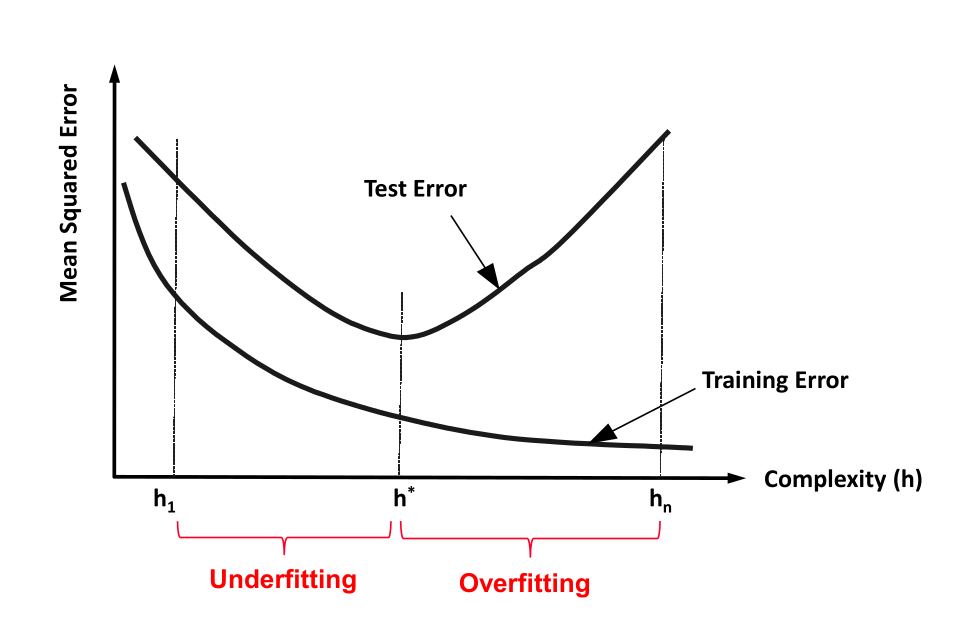
Complexity and generalization
Relationship of \(\lambda\) and complexity
Regularization strength
Model complexity
Effect
\(\lambda = 0\)
Relatively high
The penalty has no effect; ridge regression produces the ordinary least squares estimates.
\(\lambda \rightarrow \infty\)
Lowest
The slope coefficients approach zero, so predictions approach the intercept: \(\hat{y} = \beta_0\).
Example:
Distance-based models: k-NN
k-NN for classification
k-Nearest Neighbors (k-NN) is often used for clustering, but it can also be adapted to classification and regression tasks. It is particularly useful in settings where a set of observations has already been labeled, and the objective is to assign labels or predict values for new, unlabeled observations.
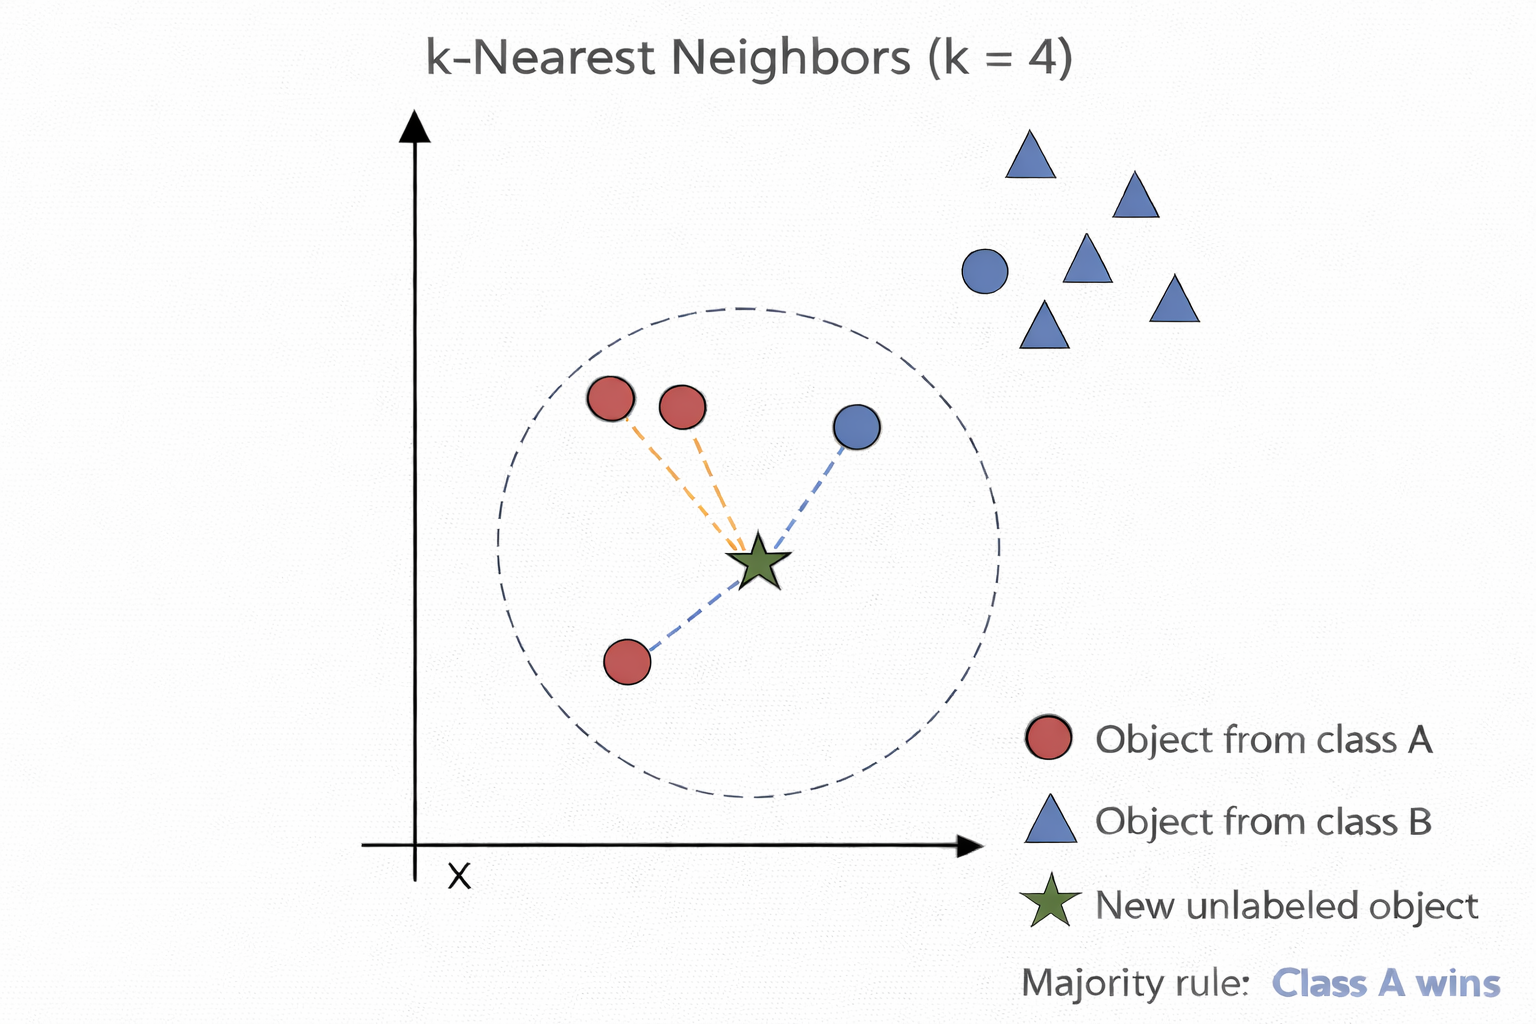
The method operates by identifying the k most similar observations to a given data point, based on a chosen distance metric (e.g., Euclidean distance). In classification tasks, the new observation is assigned the class label that is most frequent among its k nearest neighbors.
Procedure of k-NN for classification:
Determine parameter k (= number of nearest neighbors)
Calculate the distances between the new object and all known labeled objects.
Choose the k objects from all known labeled objects having the smallest distance to the new object as nearest neighbors.
Count the frequencies of the classes of the nearest neighbors.
Assign the new object to the most frequent class.
k-NN for regression
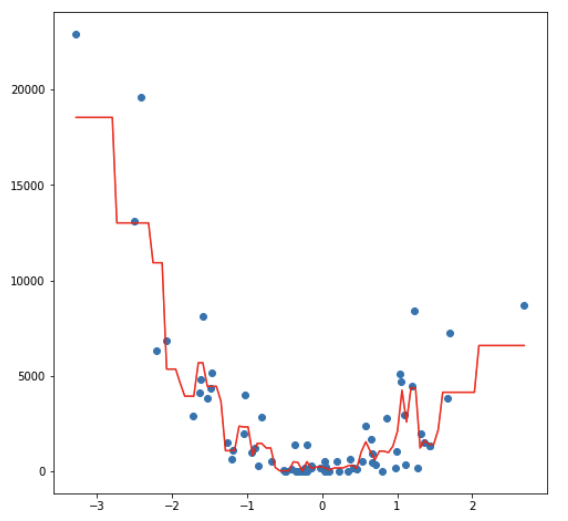
k-NN can also be used for regression. The only difference in regression is that the prediction is not the result of a majority vote but of an averaging process.
A simple implementation of k-NN regression is to calculate the average of the numerical target of the k-nearest neighbors. Another approach uses an inverse distance weighted average of the K-nearest neighbors. k-NN regression uses the same distance functions as k-NN classification.
Decision trees
Comparing decision trees
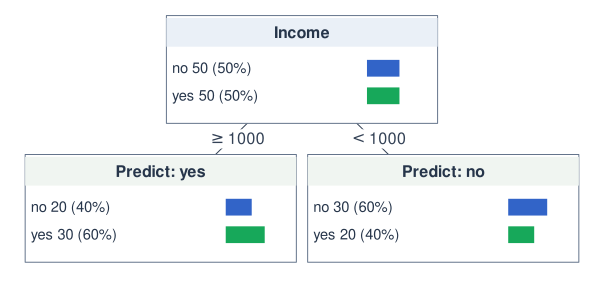
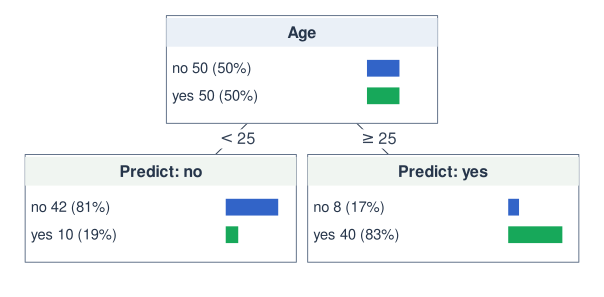
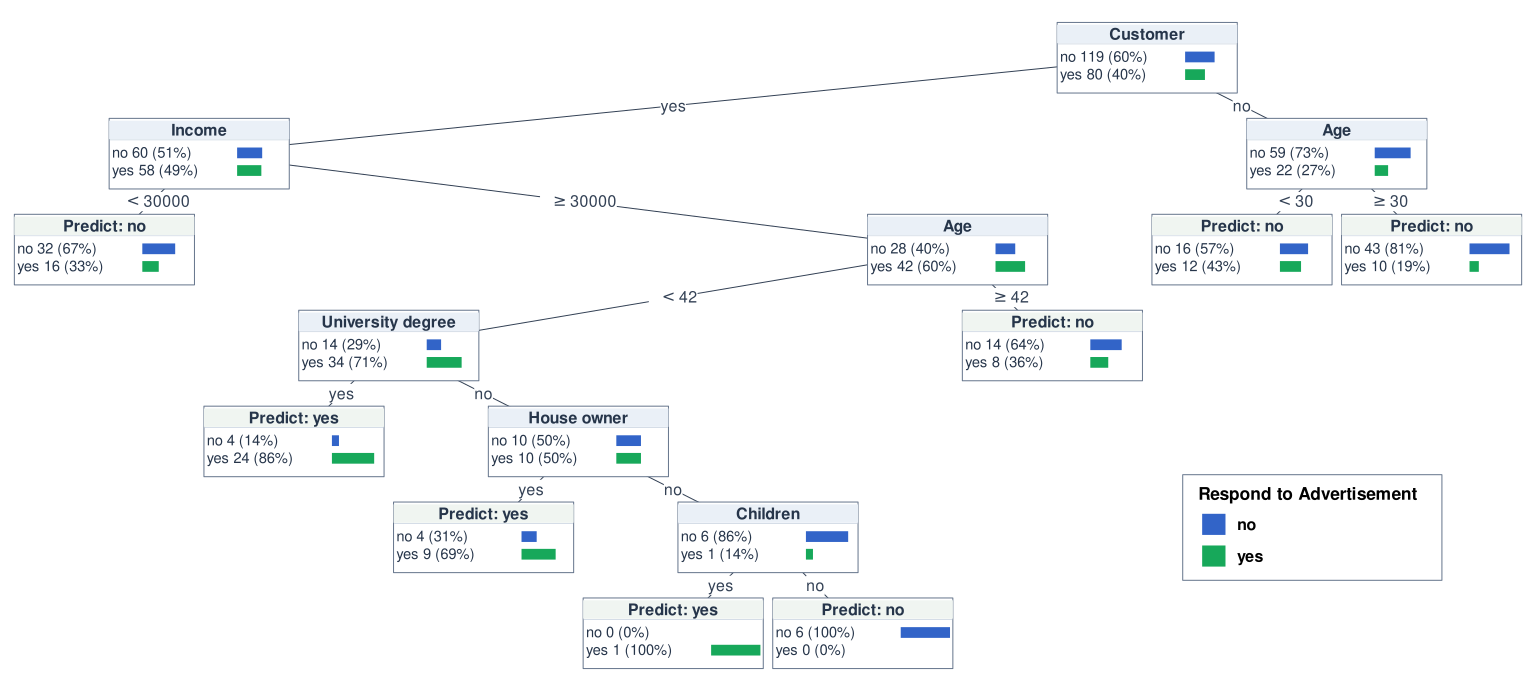
The following decision trees predict whether a person will respond to recent advertisements:
Respond to Advertisement:
No
Yes
Which one is better?
Introductory example
Decision trees (I)
Decision trees are hierarchical models used for classification and regression, based on recursive partitioning of the feature space.
A decision tree consists of:
a root node (topmost node, contains all observations)
internal (decision) nodes (perform splits based on features)
Each internal node splits the data into disjoint subsets based on a feature and a splitting criterion (e.g., entropy, Gini index).
The tree is built recursively:
Start with all observations at the root
Select the feature and split that best improves homogeneity
Partition the data accordingly
Repeat the process for each subset until a stopping criterion is met
If each node has exactly two child nodes, the tree is called a binary tree.
Decision trees (II)
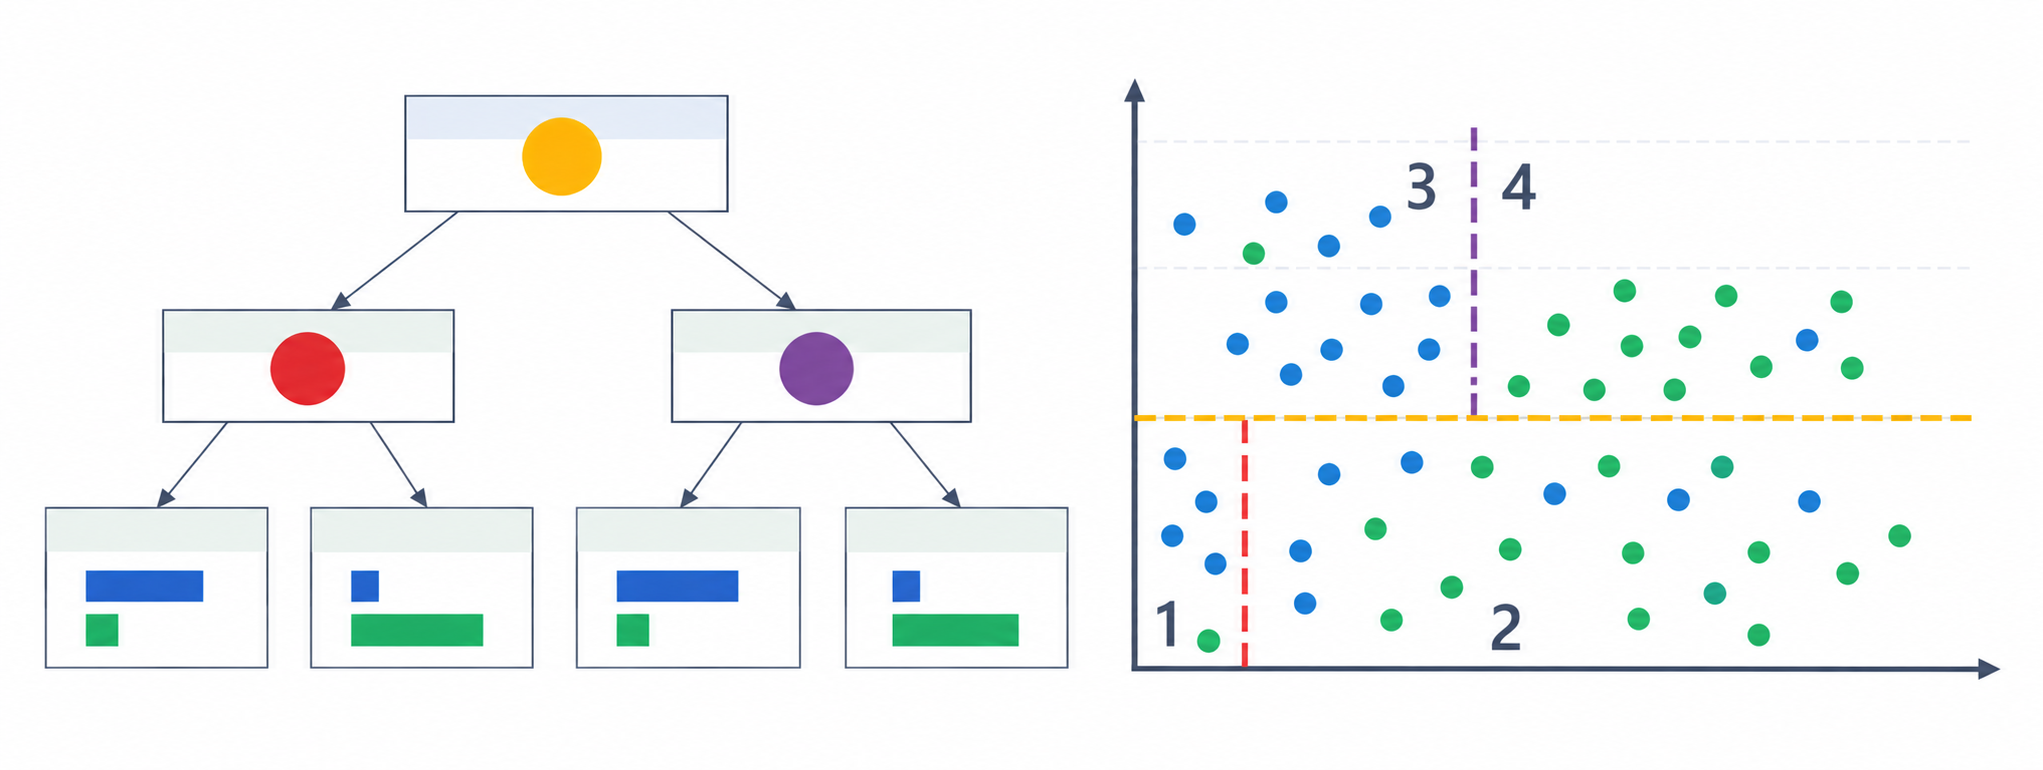
Decision tree models partition the feature space into a set of regions by recursively splitting the data to achieve maximum homogeneity within each region.
They can be interpreted as a set of decision paths: for a given combination of predictor values, an observation follows a specific path from the root to a leaf node, where a prediction (classification or regression) is assigned.
Decision trees make few assumptions about the functional form of relationships or data distributions. In contrast to parametric models (e.g., linear regression), they can capture nonlinear patterns, interactions, and complex structures in the data that are difficult to model with linear approaches.
Overview of important decision tree methods
Name
Idea
Measure used
Type of splitting
CART
Select the split that maximizes impurity reduction
Gini index
Binary
ID3
A foundational decision-tree algorithm that selects splits by maximizing information gain
Information gain (entropy)
Multiway; no pruning
C5.0
An extension of ID3 with improved splitting and pruning
Gain ratio
Binary or multiway; pruning
CHAID
Select the attribute most strongly associated with the target variable
Chi-square test
Multiway; pre-pruning
Random forests
Construct many trees using randomly selected samples and features; aggregate predictions by voting
Usually Gini index
Binary; typically unpruned
Introductory example
Day
Outlook
Temperature
Humidity
Wind
Play tennis
1
sunny
hot
high
light
no
2
sunny
hot
high
strong
no
3
overcast
hot
high
light
yes
4
rainy
mild
high
light
yes
5
rainy
cold
normal
light
yes
6
rainy
cold
normal
strong
no
7
overcast
cold
normal
strong
yes
8
sunny
mild
high
light
no
9
sunny
cold
normal
light
yes
10
rainy
mild
normal
light
yes
11
sunny
mild
normal
strong
yes
12
overcast
mild
high
strong
yes
13
overcast
hot
normal
light
yes
14
rainy
mild
high
strong
no
Features
Class variable
Splitting with entropy in ID3
ID3 uses entropy as a measure of impurity of a node \(t\):
We choose the attribute with the largest information gain
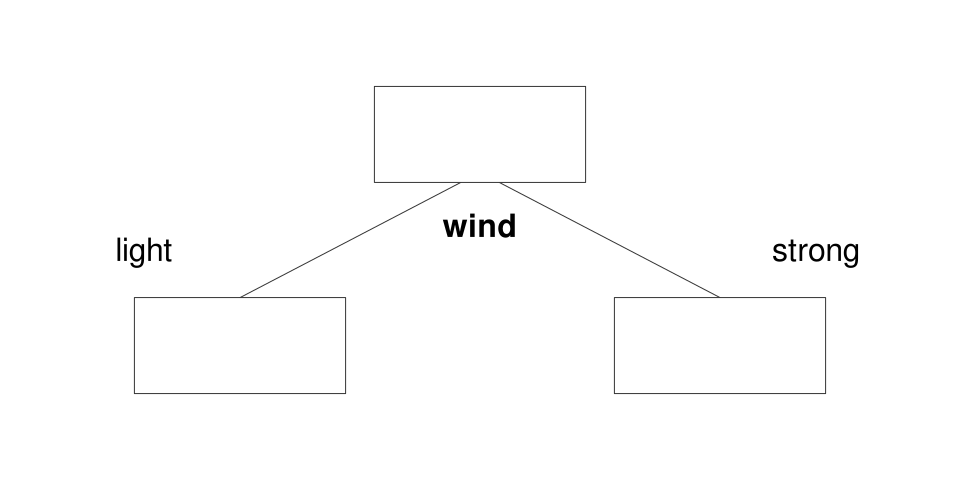
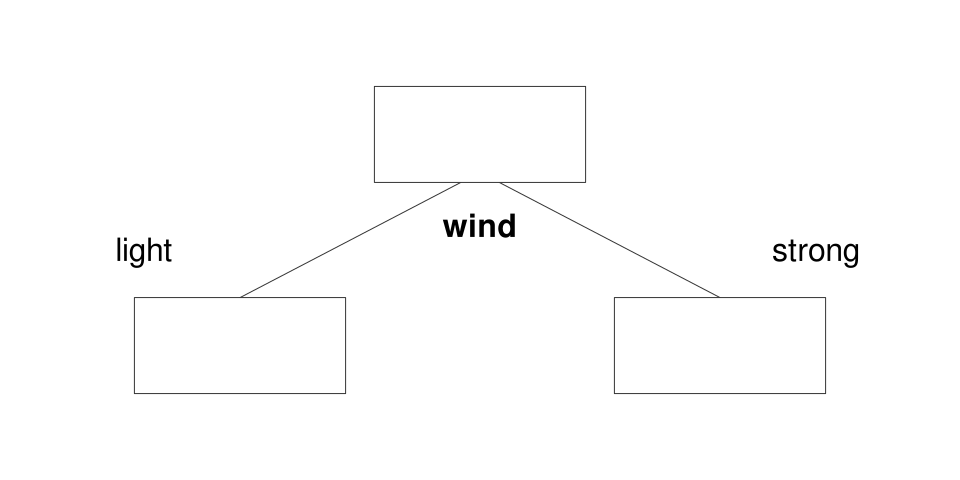
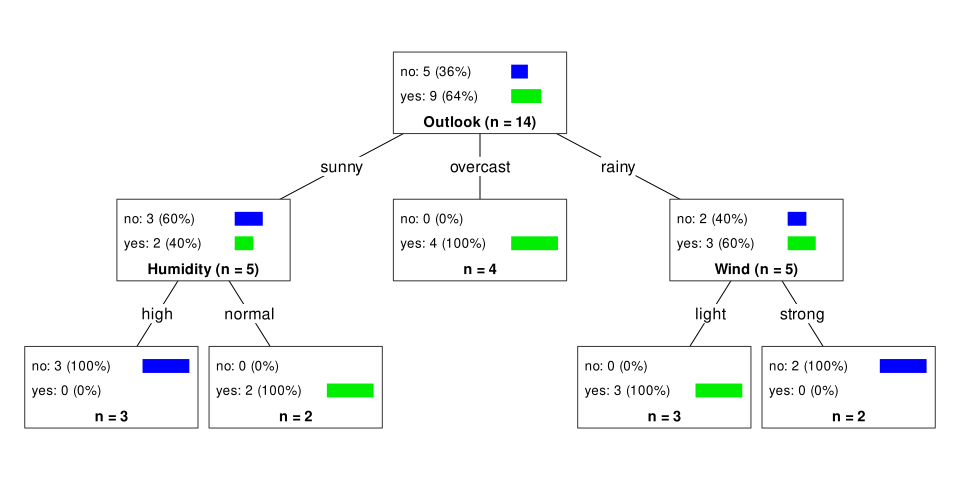
→ Outlook is used for the first split
How ID3 builds the tree
ID3 is a greedy, recursive procedure:
At each node:
Compute information gain for all remaining attributes
Select the best attribute (highest gain)
Split the data
Repeat the process within each subset
This continues until:
nodes are pure, or
no attributes remain
This produces this decision tree:
Decision using C5.0
ID3 tends to favor attributes that have a large number of values, resulting in larger trees. For example, if we have an attribute that has a distinct value for each record, then the entropy is 0, thus the information gain is maximal.
To compensate for this, C5.0 is a further development that uses the information gain ratio as a splitting criterion:
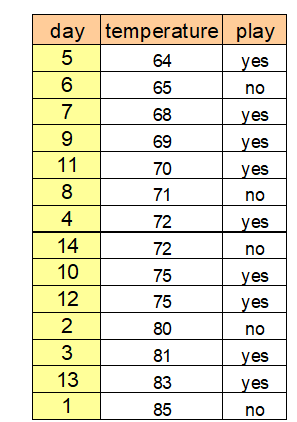
Numerical attributes are (typically) split into two groups. In contrast to categorical attributes many possible splitting points exist.
The splitting point with the highest information gain is looked for. For this, the potential attribute is sorted according to its values first and then all possible splitting point and the corresponding information gains are calculated. In extreme cases there exists n-1 possibilities.
Test the splitting point \(\text{temperature} = 71.5\):
\(\text{temperature} < 71.5\): 4 \(\times\) yes, 2 \(\times\) no
Most decision tree algorithms partition training data until every node contains objects of a single class, or until further partitioning is impossible because two objects have the same value for each attribute but belong to different classes. If there are no such conflicting objects, the decision tree will correctly classify all training objects.
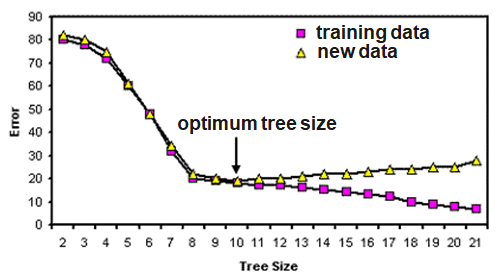
If tree performance is measured from the number of correctly classified cases it is common to find that the training data gives an over-optimistic guide to future performance, i.e. with new data. A tree should exhibit generalization, i.e. work well with data other than those used to generate it. When the tree grows during training it often shows a decrease in generalization. This is because the deeper nodes are fitting noise in the training data not representative over the entire universe from which the training set was sampled. This is called ‘overfitting’.
Random forest (I)
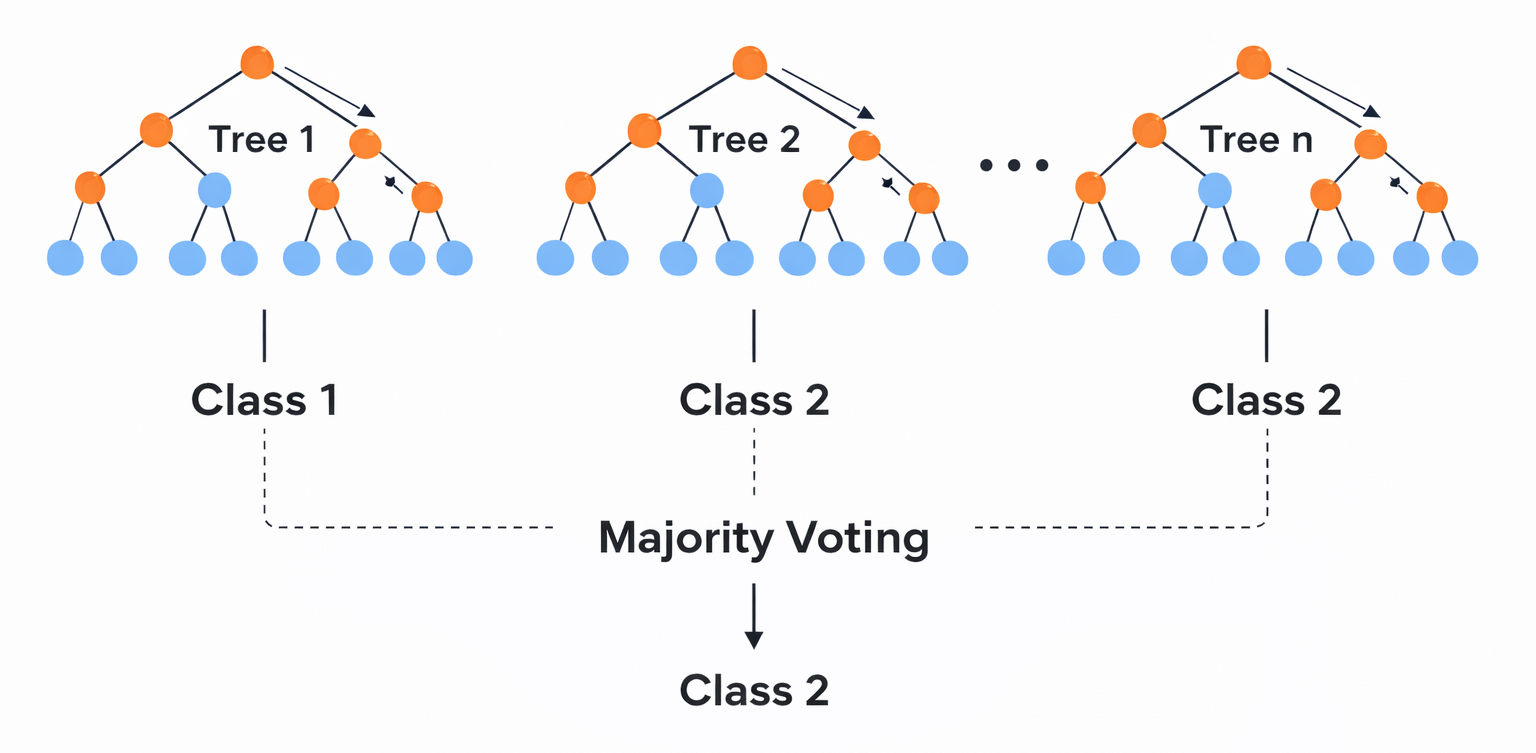
Random forest is an ensemble classifier that consists of many decision trees.
For every tree a subset of the data objects and a subset of features is randomly chosen. Then the tree is constructed usually using the Gini Index.
In the end, a simple majority vote is taken for prediction.
Algorithm:
Create n samples from the original data. The sample size is often 2/3.
For each of the samples, grow a tree, with the following modification: at each node, rather than choosing the best split among all predictors, randomly sample m* of the m predictors and choose the best split from among those variables.
Predict by aggregating the predictions of the n trees (majority votes).
Random forest (II)
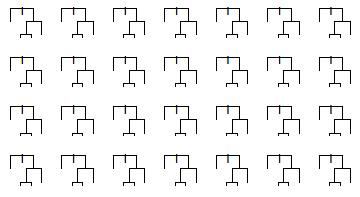
Voting principle of random forest:
To avoid overfitting effects, the size and the depth of the trees can be restricted.
Regression trees
Regression trees predict a numerical target variable and can capture nonlinear relationships involving multiple predictors.
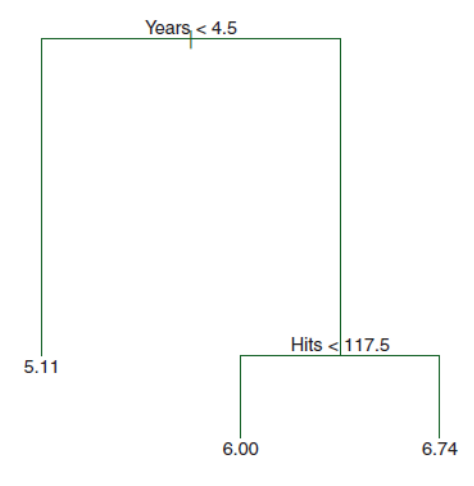
The figure shows a regression tree predicting the natural logarithm of a baseball player’s salary (in thousands of dollars), based on:
Years played in the major leagues
Number of hits in the previous year
Each leaf predicts the mean log-salary of the training observations in that region.
For players with Years < 4.5, the predicted log-salary is 5.11. We convert this back into dollars using the exponential function:
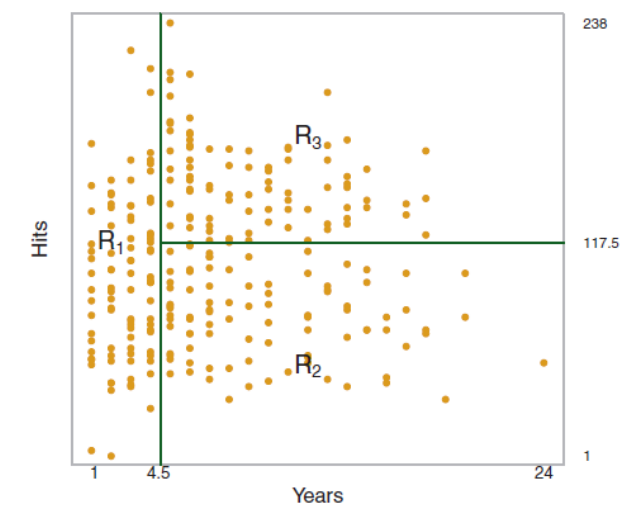
A regression tree partitions the data objects in the feature space into regions \(R_j\), represented by the leaves of the tree. To construct the tree, the goal is to find regions that minimize the RSS, given by
where \(\bar{y}_{R_j}\) is the mean value for the training observations within the \(j\)th region with \(\hat{y}_{R_j} = \bar{y}_{R_j}\).
To perform the recursive binary splitting, we first select the feature \(X_j\) and the cutpoint \(s\) such that splitting the feature space into the regions \(X_j < s\) and \(X_j \ge s\) leads to the greatest possible reduction in RSS. We consider all features and all possible values of the cutpoint s for each of the features, and then choose the feature and cutpoint such that the resulting tree has the lowest RSS.
Constructing a regression tree (II)
At each node, we evaluate all available features \(j\) and possible cutpoints \(s\) and select the combination that minimizes the residual sum of squares (RSS):
where \(\bar{y}_{R_1}\) and \(\bar{y}_{R_2}\) are the mean target values of the training observations in the two resulting regions.
Recursive splitting: After selecting the best feature and cutpoint, we repeat this search independently within each child node, again considering all available features and cutpoints.
The process continues until a stopping criterion is reached (e.g., a minimum number of observations per leaf).
Each terminal region \(R_1, \ldots, R_J\) predicts the mean target value of its training observations.
To reduce overfitting, tree complexity can be controlled through stopping criteria or pruning.
Random forests for regression
Due to the usage of means as predictors a regression tree usually simplifies the true relationship between the inputs and the output. The advantage over traditional statistical methods is, that it can give valuable insights about which variables are important and where. But the prediction ability is poor compared to other regression approaches.
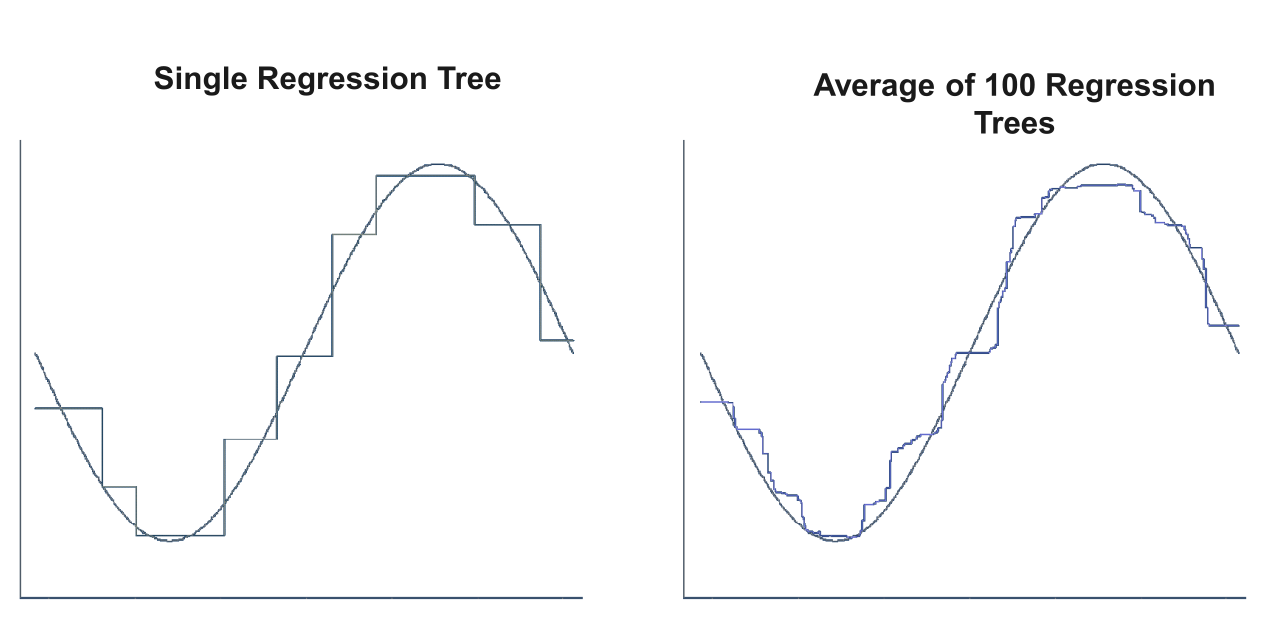
A much better prediction quality can be achieved with the creation of an ensemble of trees, use them for prediction and averaging their results. This is done, when applying the random forests approach to a regression task.
Regression forests are an ensemble of different regression trees and are used for nonlinear multiple regression. The principle is the same as in classification, except that the output is not the result of a voting but instead of an averaging process.
The disadvantage of random forests is that the analysis, which aggregates over the results of many bootstrap trees, does not produce a single, easily interpretable tree diagram.
Comparing the fitting ability of one vs. many regression trees
Limitations of tree methods in regression
When applied to regression problems, tree methods have the limitation that they cannot exceed the range of values of the target variable used in training. The reason for this lies in their design principle, how the leaves of the trees are created.
Thus, random forests may perform poorly when the target data is out of the range of the original training data, e.g. in the case of data with persistent trends. A solution may be a frequent re-training in this case.
An important strength of random forests is that they are able to perform well in the case of missing data. According to their construction principle, not every tree is using the same features.
If there is any missing value for a feature during the application there usually are enough trees remaining that do not use this feature to produce accurate predictions.
Support vector machines
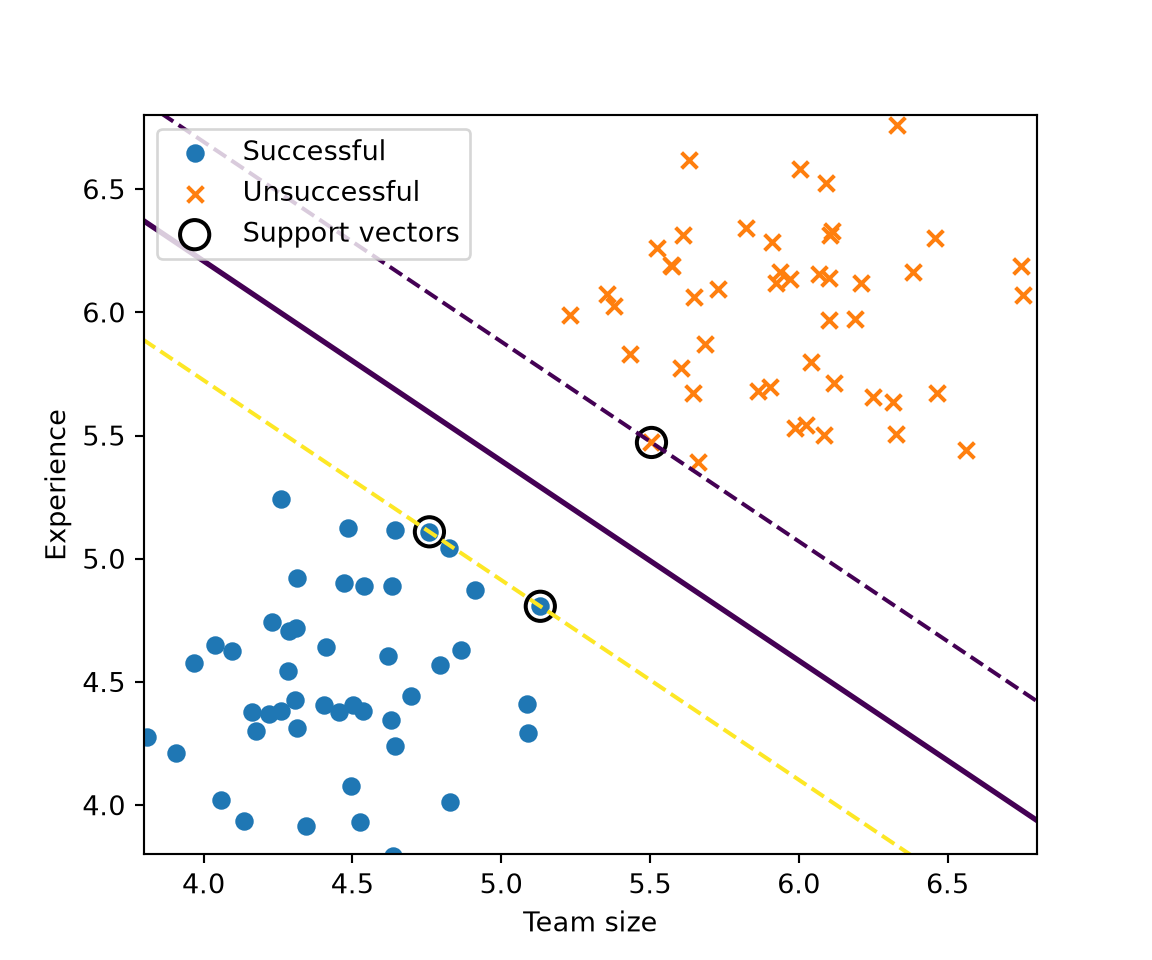
The idea: separating with a line (or hyperplane)
Imagine you have two groups of points. SVM tries to separate them with a line (in 2D) or a hyperplane (in higher dimensions).
Mathematically, a hyperplane is:
\[w^\top x + b = 0\]
\(x\): data point (features, e.g., income, age)
\(w\): weight vector (defines orientation)
\(b\): bias (shifts the line/hyperplane)
The predictions are:
Class +1 if \(w^\top x + b > 0\)
Class −1 if \(w^\top x + b < 0\)
The key principle: maximize the margin
SVM doesn’t pick just any separating line. It chooses the one with the largest margin (distance to the closest points).
Constraint ensures correct classification with margin
Interpretation: We want all points correctly classified and as far from the boundary as possible.
Allowing mistakes (soft margin)
Real-world data is messy. So we allow violations using slack variables \(\xi_i\):
\[\min_{w,b} \frac{1}{2} |w|^2 + C \sum_i \xi_i
\quad \text{subject to} \quad
y_i (w^\top x_i + b) \geq 1 - \xi_i\]
\(\xi_i\): how much a point violates the margin
\(C\): regularization parameter (trade-off)
Large (C): fewer mistakes, tighter fit
Small (C): more tolerance, smoother boundary
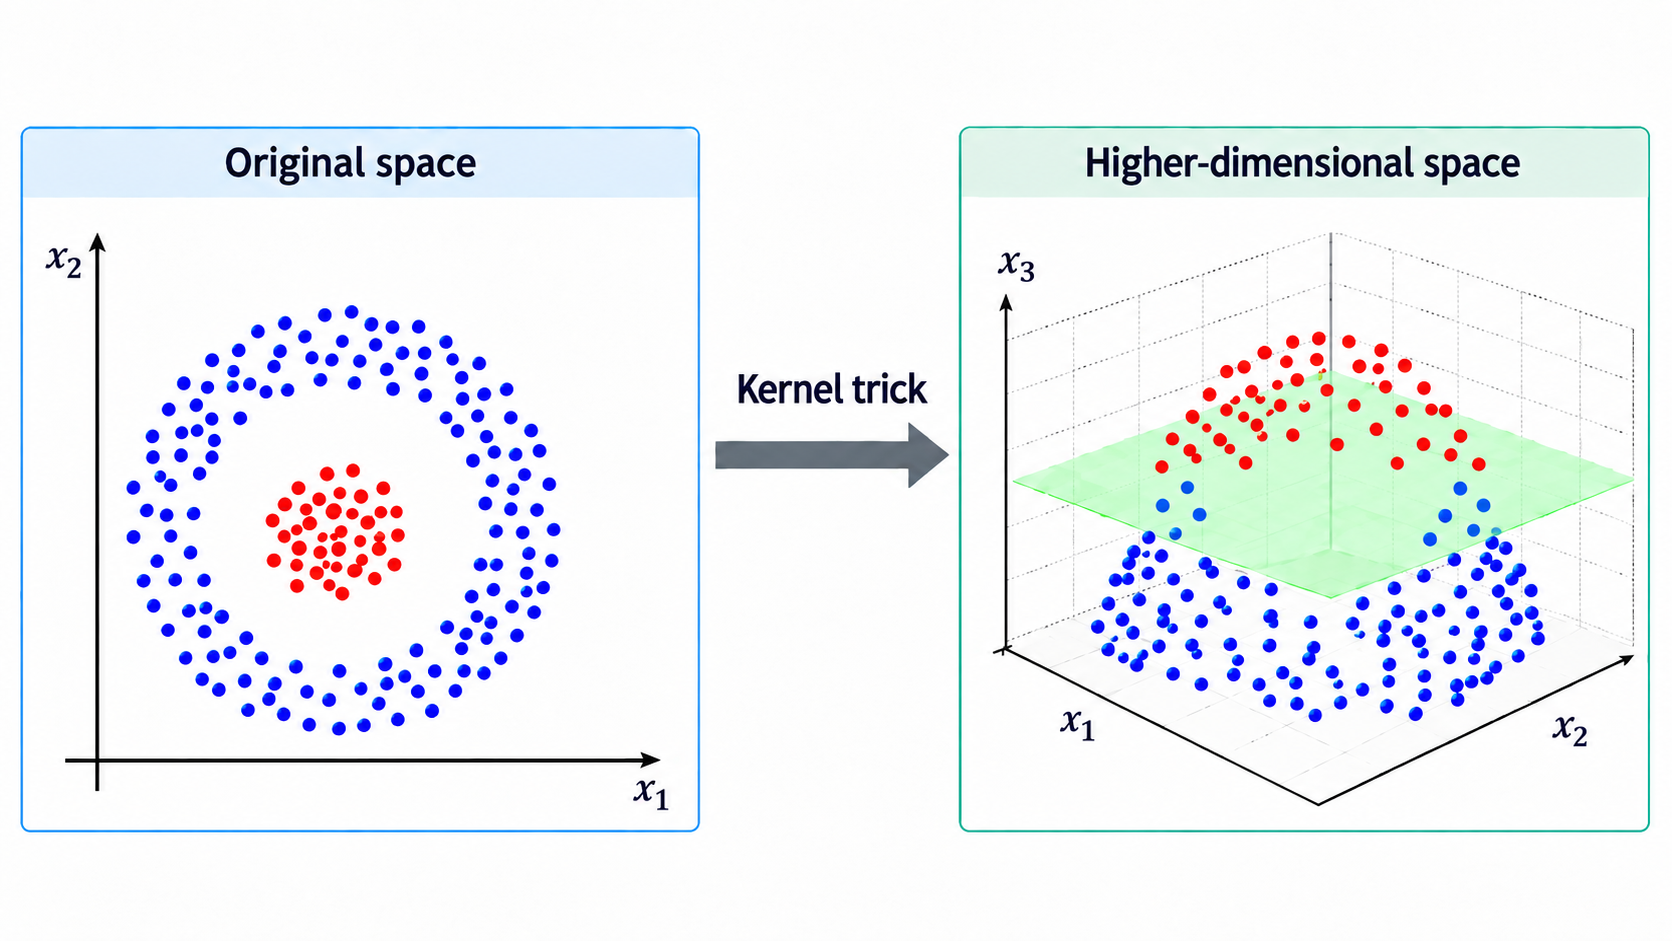
Nonlinear boundaries via the kernel trick
What if data isn’t linearly separable?
Instead of transforming data explicitly, SVM uses a kernel function:
\[K(x_i, x_j) = \phi(x_i)^\top \phi(x_j)\]
The kernel trick replaces inner products with a kernel function, allowing us to compute similarities as if the data were mapped to a higher-dimensional space—without ever computing \(\phi(x)\) directly.
Common kernels:
Linear: \(K(x_i, x_j) = x_i^\top x_j\)
Polynomial
RBF (Gaussian): captures complex patterns
Intuition: SVM can create curved decision boundaries by working in an implicit higher-dimensional space.
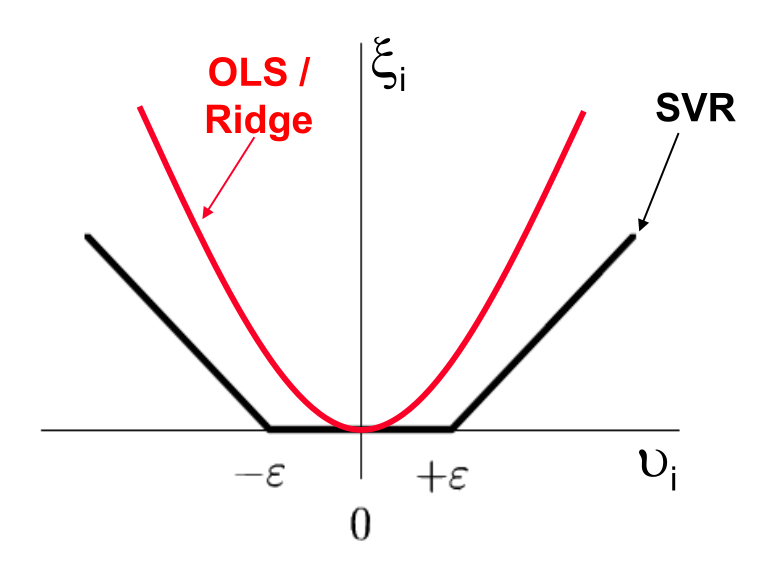
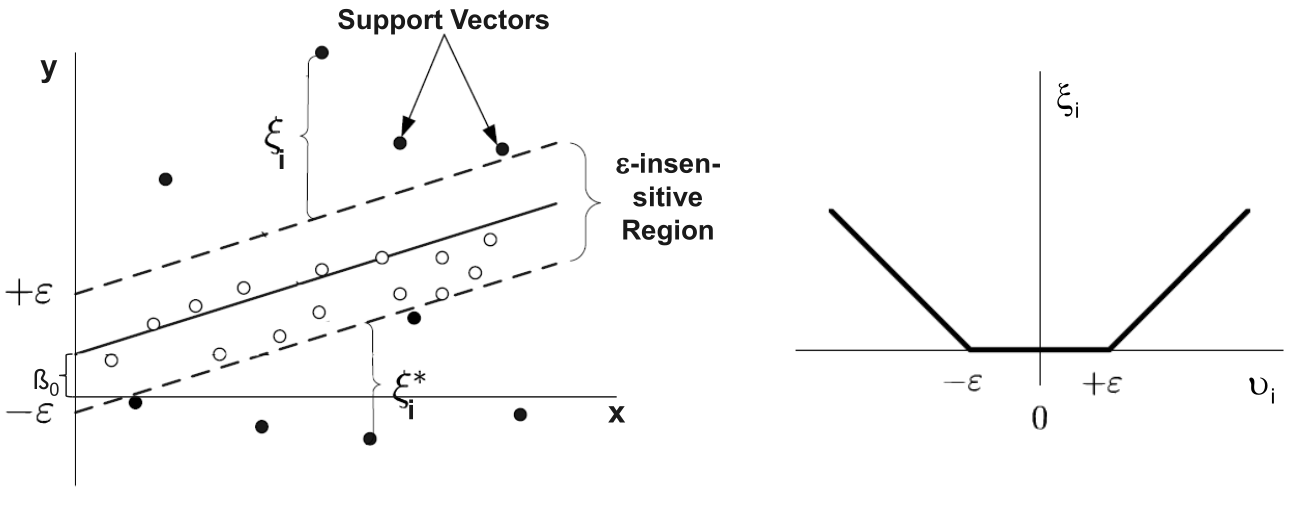
\(\frac{1}{2}\lVert\boldsymbol{\beta}\rVert^2\) controls model complexity.
\(\sum_i L_\varepsilon(y_i-f(x_i))\) penalizes errors outside the \(\varepsilon\)-tube.
\(\varepsilon\) controls the tube width.
\(C\) controls the trade-off between flatness and fitting violations.
Kernel functions
Kernel Functions are used to project n-dimensional input to m-dimensional input, where m is higher than n:
Any point x in the original space is mapped into the higher dimensional space. For reason of efficiency, the mapping is not performed in real but instead embedded in the model building process via the kernel function:
Instead of \(\beta_0 + \beta\cdot x = y\) the following is used: \(\beta_0 + \beta \cdot \phi(x) = y\).
The main idea to use a kernel is: A nonlinear pattern in the original, lower-dimensional space can become linearly separable in a higher-dimensional feature space.
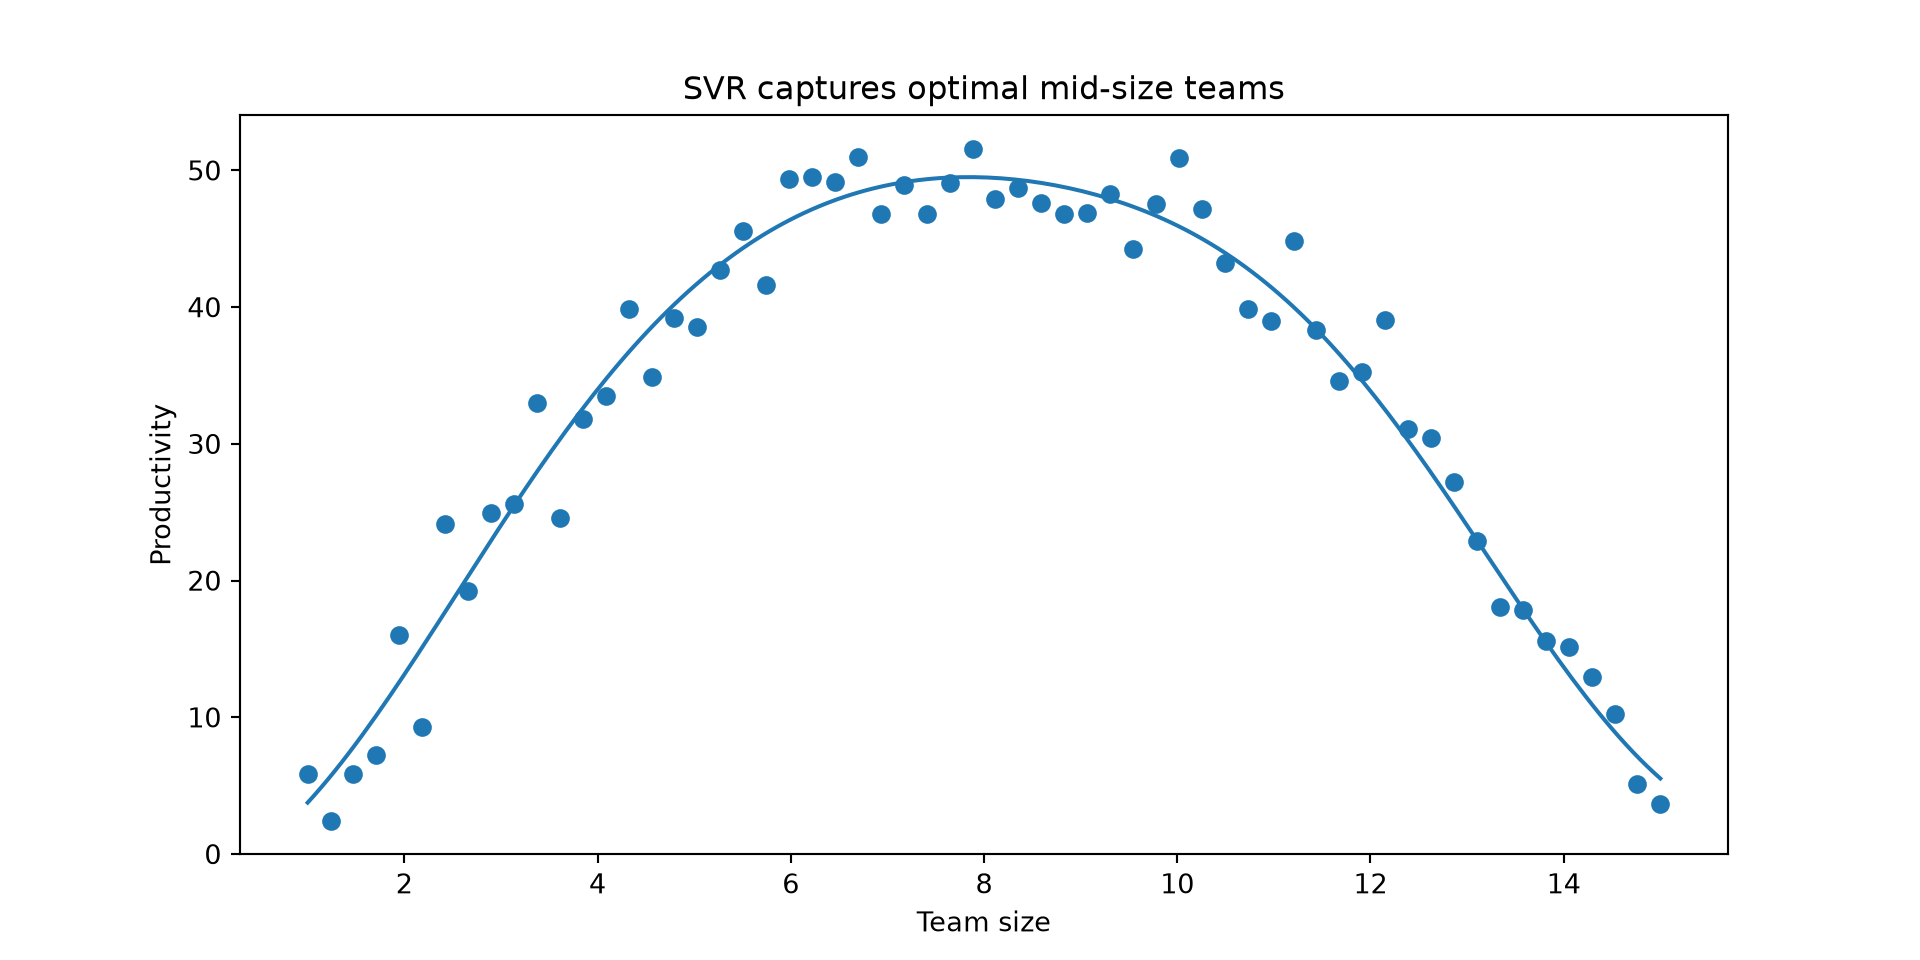
SVR examples (I)
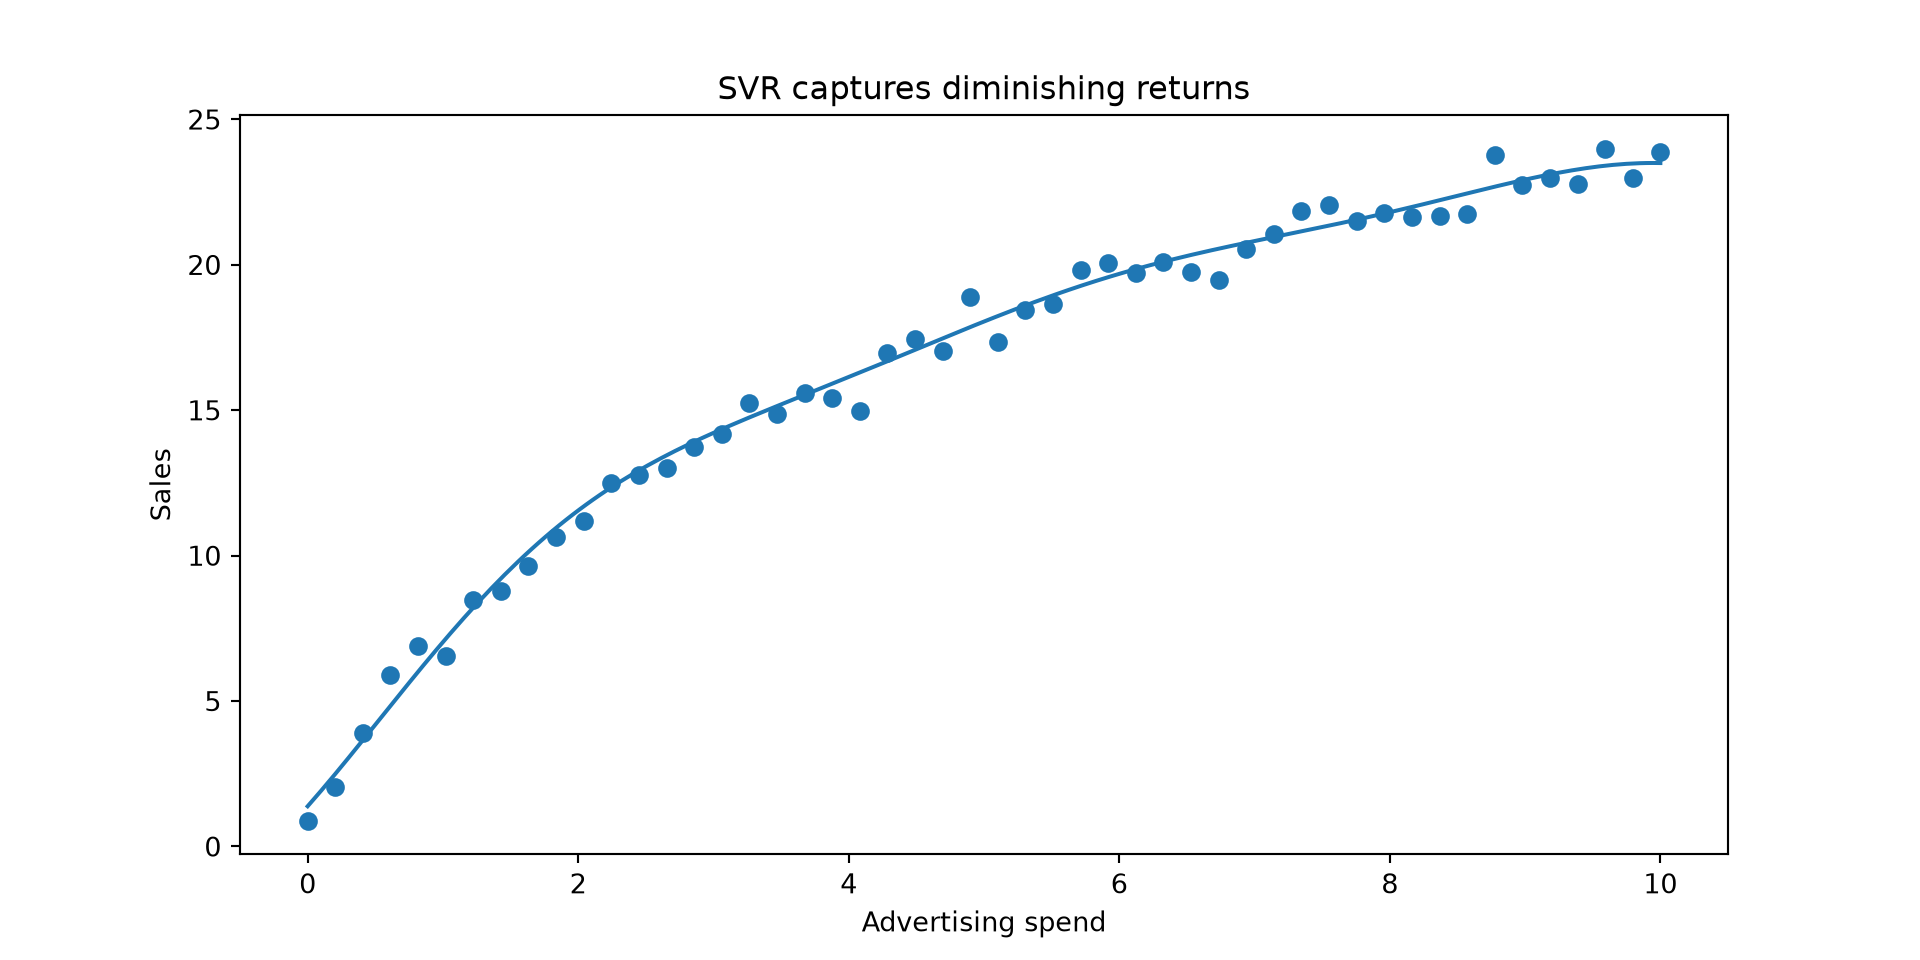
SVR examples (II)
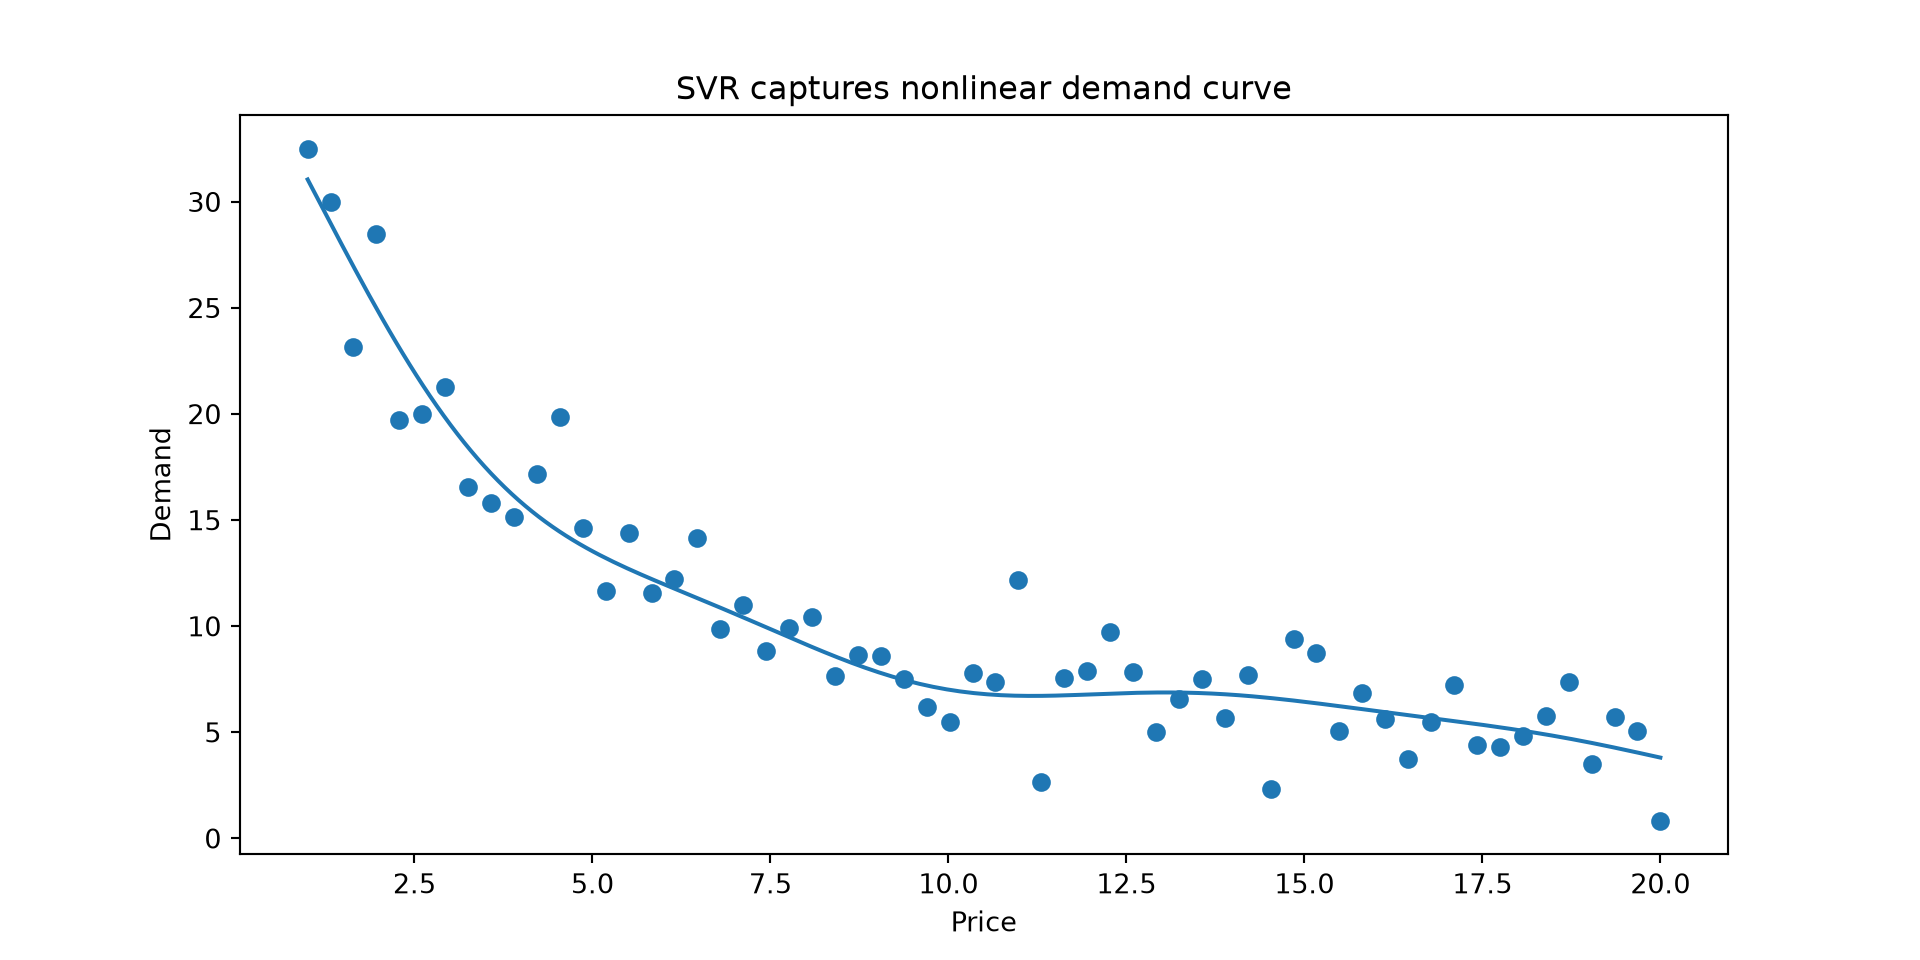
SVR examples (III)
Summary
Supervised machine learning includes a variety of model families (linear, distance-based, tree-based, margin-based, neural networks) that can be applied to both classification and regression tasks. Model choice depends on data characteristics, problem complexity, and the trade-off between interpretability and predictive performance.
Different models embody different assumptions and levels of flexibility: linear models are simple and interpretable, while more flexible models (e.g., trees, SVMs, neural networks) can capture complex, non-linear relationships but are harder to interpret.
Controlling model complexity is central to achieving good generalization. Techniques such as regularization (Ridge, Lasso), parameter choices (e.g., k in k-NN, depth in trees), and margin control (SVM) balance fit and simplicity.
Key supervised learning algorithms introduced include k-Nearest Neighbors (k-NN) (distance-based), decision trees and random forests (tree-based and ensemble methods), and Support Vector Machines (SVMs) (margin-based models), illustrating different approaches to learning from data with varying assumptions, flexibility, and interpretability.
Feedback
Please take 1–2 minutes to reflect on today's session.