Machine Learning for Big Data
Session 5 | 2026-09-17
A lost customer is often a predictable customer. Firms collect many traces of customer relationships — usage, spending, support interactions, contract data. The analytical challenge is to turn these traces into an early warning system.
Typical variables in a churn dataset

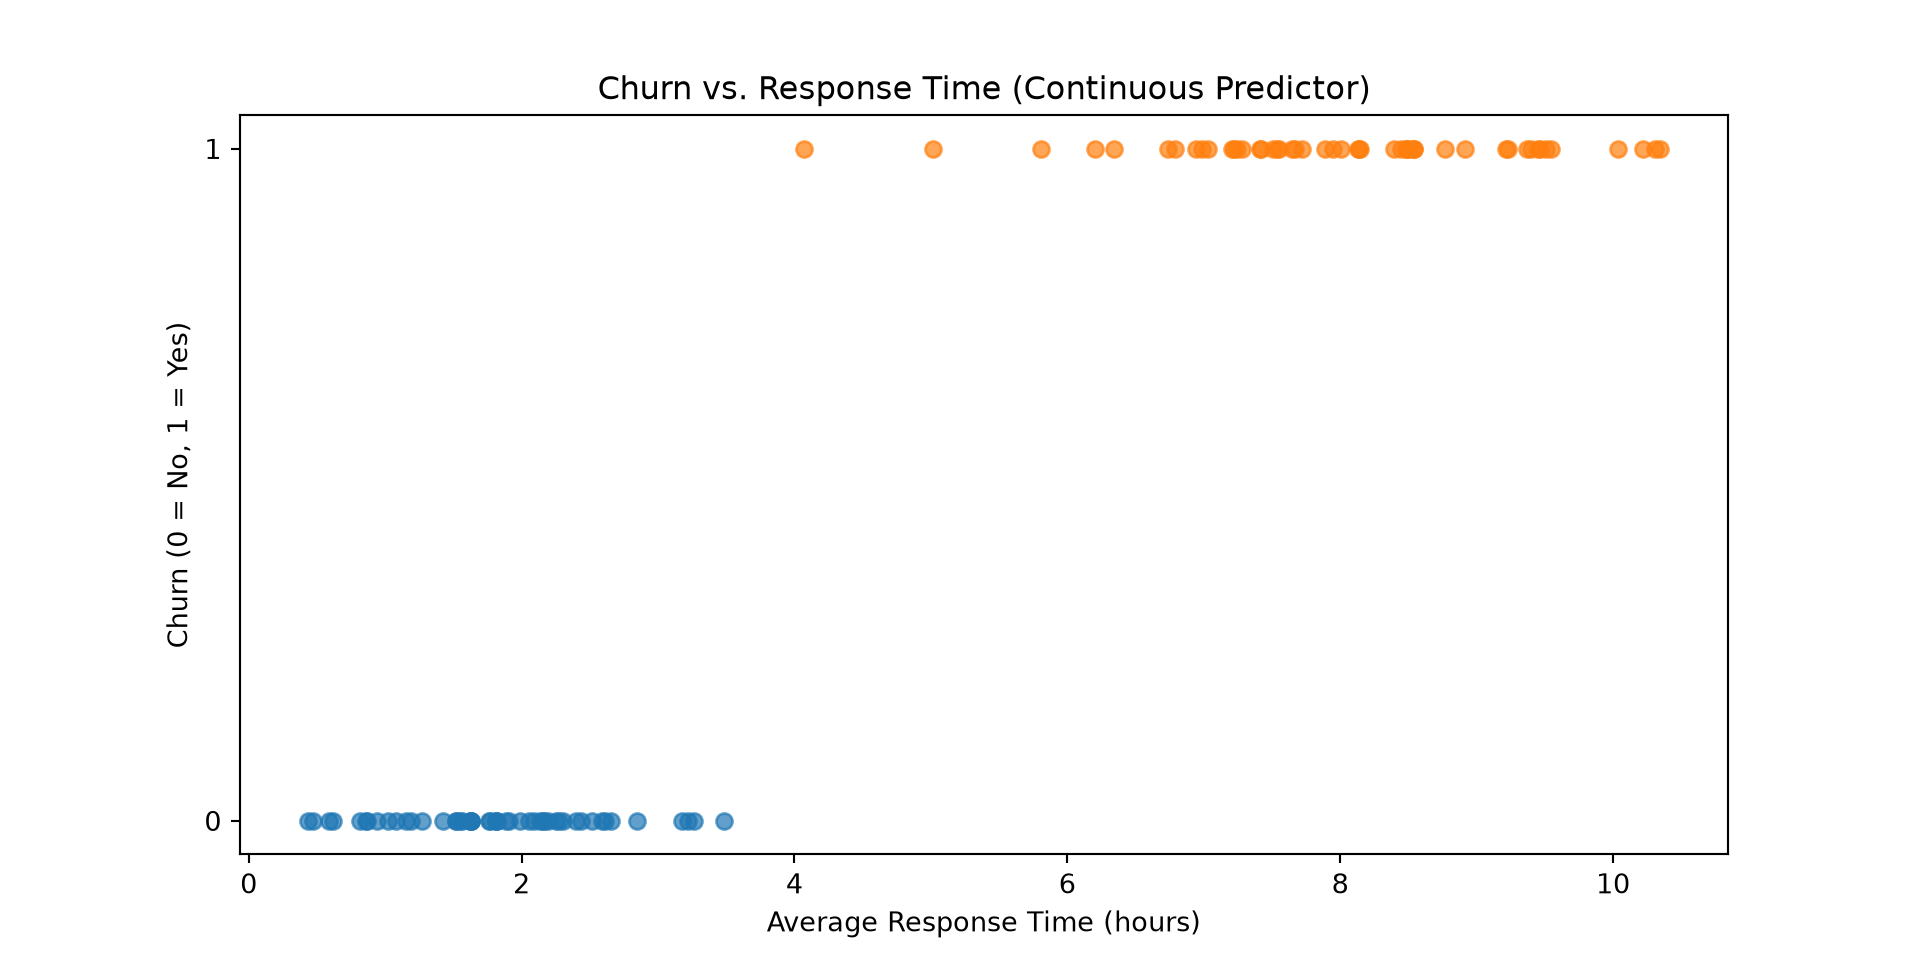
Churn prediction is a binary classification problem:

Possible approach: We could use Linear Regression with a threshold at 0.5 to classify output:
y=0y=1Examples:
\[y \in \{0,1\}\] with
0: “Negative class” (e.g., no fraud, no churn, no spam)
1: “Positive class” (e.g., fraud, churn, spam)
Ideally, our model should predict the probability of \(y_i=1\). This would allow us to apply a threshold for classification, but it would also give us more information (how likely an observation belongs to the positive class).
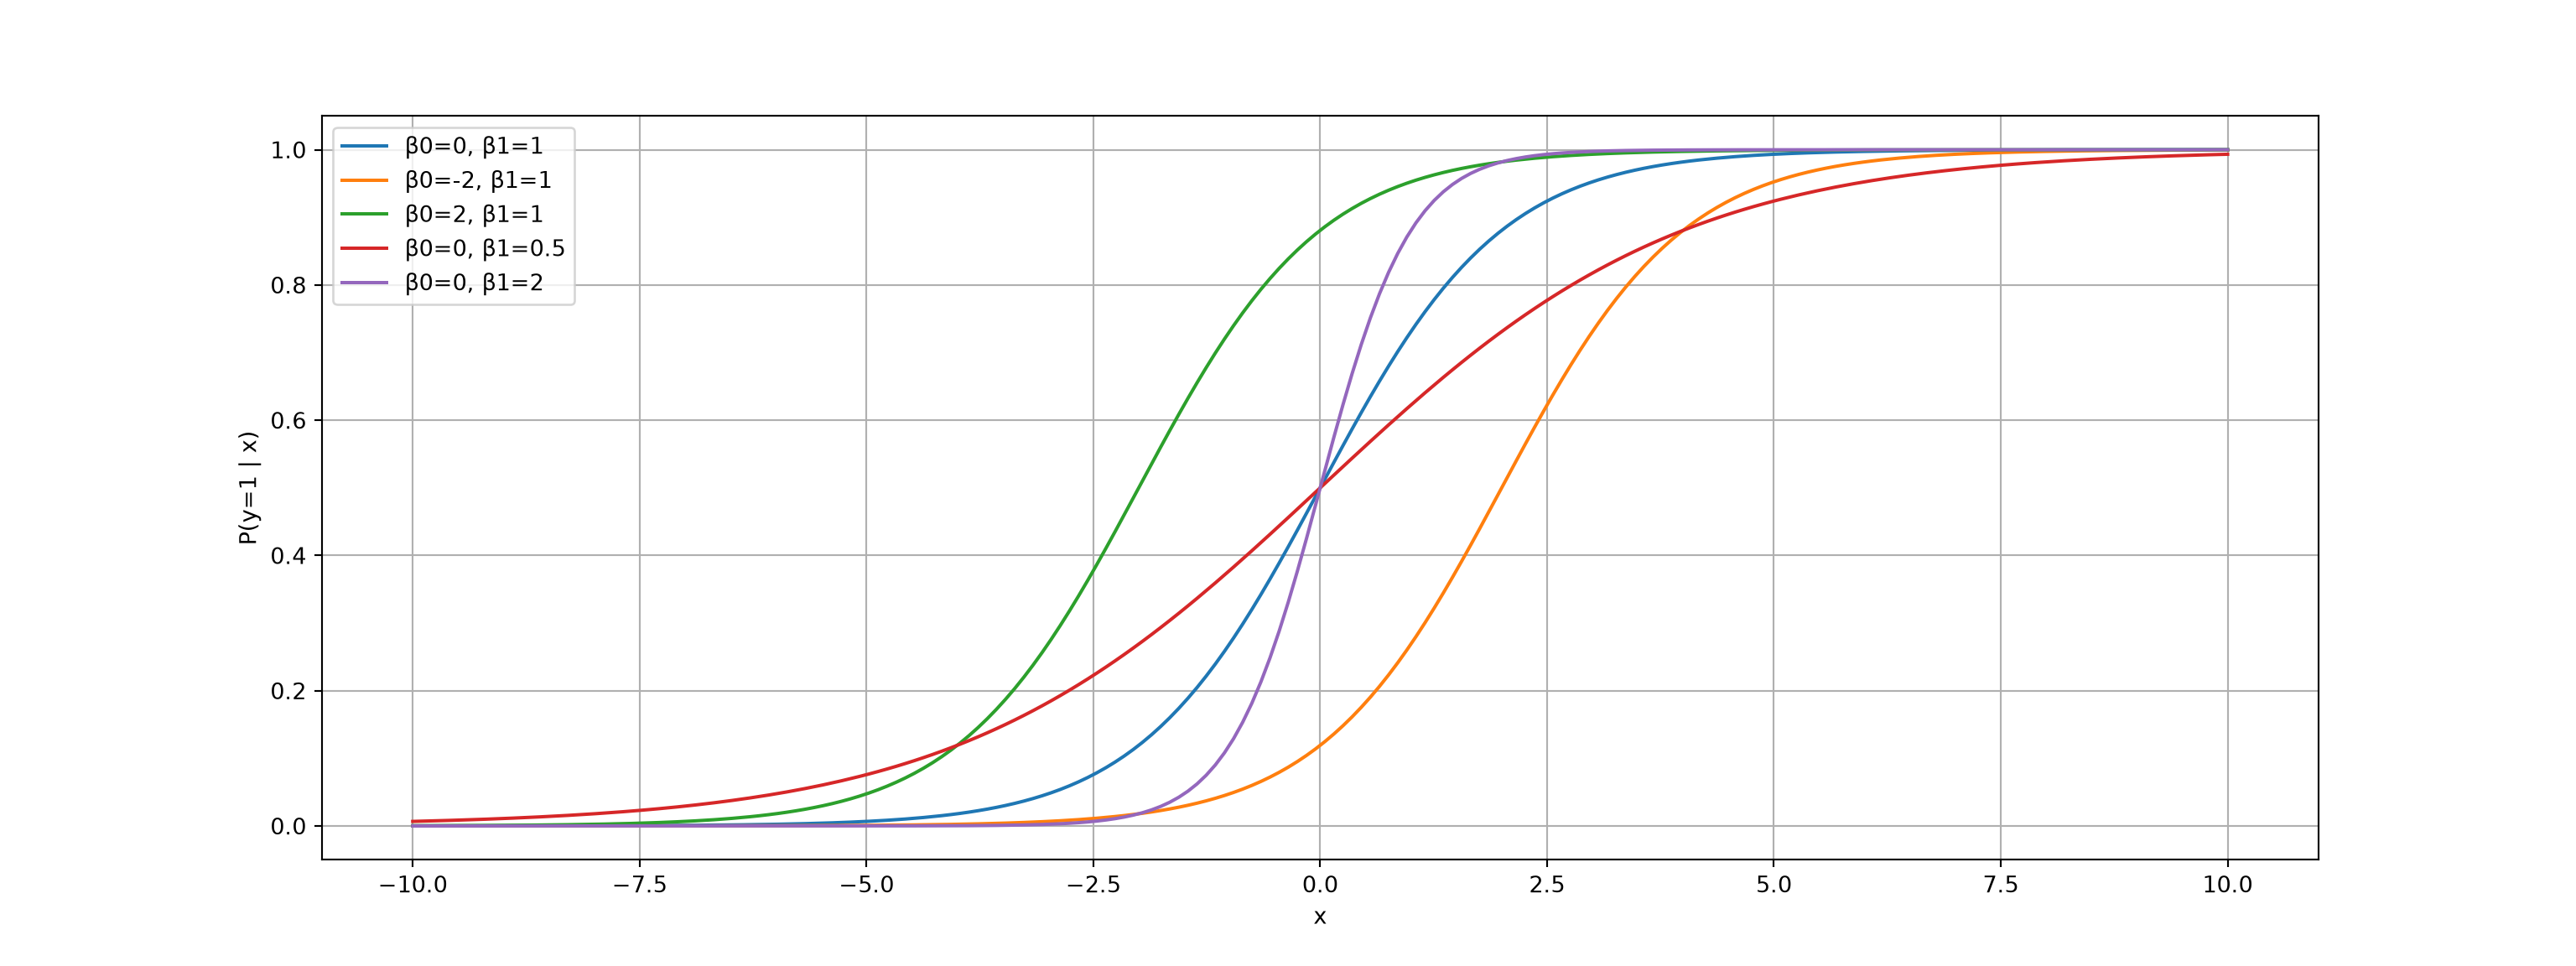
It means we need a model that produces predicted probabilities between 0 and 1:
Step 1: Linear model
\[z_i = \beta_0 + \beta_1 x_i\]
Step 2: Transform to probability via sigmoid function
\[\mathbb{P}(y_i = 1 \mid x_i) = \sigma(z_i) \text{ with } \sigma(z) = \frac{1}{1 + e^{-z}}\]
Logistic regression model
\[\mathbb{P}(y_i = 1 \mid x_i) = \frac{1}{1 + e^{-(\beta_0 + \beta_1 x_i)}}\]
Logistic regression assumes that the log-odds of the outcome are linear in the predictors:
\[\log\left(\frac{p_i}{1 - p_i}\right) = \beta_0 + \beta_1 x_i\]
Note: \(\frac{p_i}{1 - p_i}\) are the “odds”.
This implies a sigmoid-shaped relationship between \(x_i\) and the probability of \(y_i=1\):
\[p_i = \frac{1}{1 + e^{-(\beta_0 + \beta_1 x_i)}}\]
The sigmoid function serves as a link function to convert the linear predictor into a probability.

Note
Instead of minimizing squared errors, logistic regression chooses parameters that make the observed data most likely.
Core idea: We want predicted probabilities to match observed outcomes:
Likelihood function
For each observation: \(P(y_i \mid x_i) = p_i^{y_i} (1 - p_i)^{1 - y_i}\)
For all observations:
\[L(\beta) = \prod_{i=1}^n p_i^{y_i} (1 - p_i)^{1 - y_i}\]
Maximization: Choose \(\beta_0, \beta_1\) to maximize this likelihood
We estimate the model using base R’s glm() function:
# A tibble: 2 × 5
term estimate std.error statistic p.value
<chr> <dbl> <dbl> <dbl> <dbl>
1 (Intercept) -140. 306192. -0.000457 1.000
2 response_time 23.3 50231. 0.000465 1.000
Logistic regression coefficients are not directly effects on probability. They describe effects on the log-odds.
Coefficient meaning
\[\log\left(\frac{p}{1-p}\right) = \beta_0 + \beta_1 x\]
Odds ratios: Exponentiate the coefficient
Note: The effect on probability is nonlinear and depends on the starting probability.
A logistic regression model predicts a probability of churn:
\[ P(\text{churn}_i=1\mid x)=\frac{1}{1+e^{-(\beta_0+\beta_1 x_i)}} \]
A threshold (such as 0.5) is needed to convert probabilities into class labels.
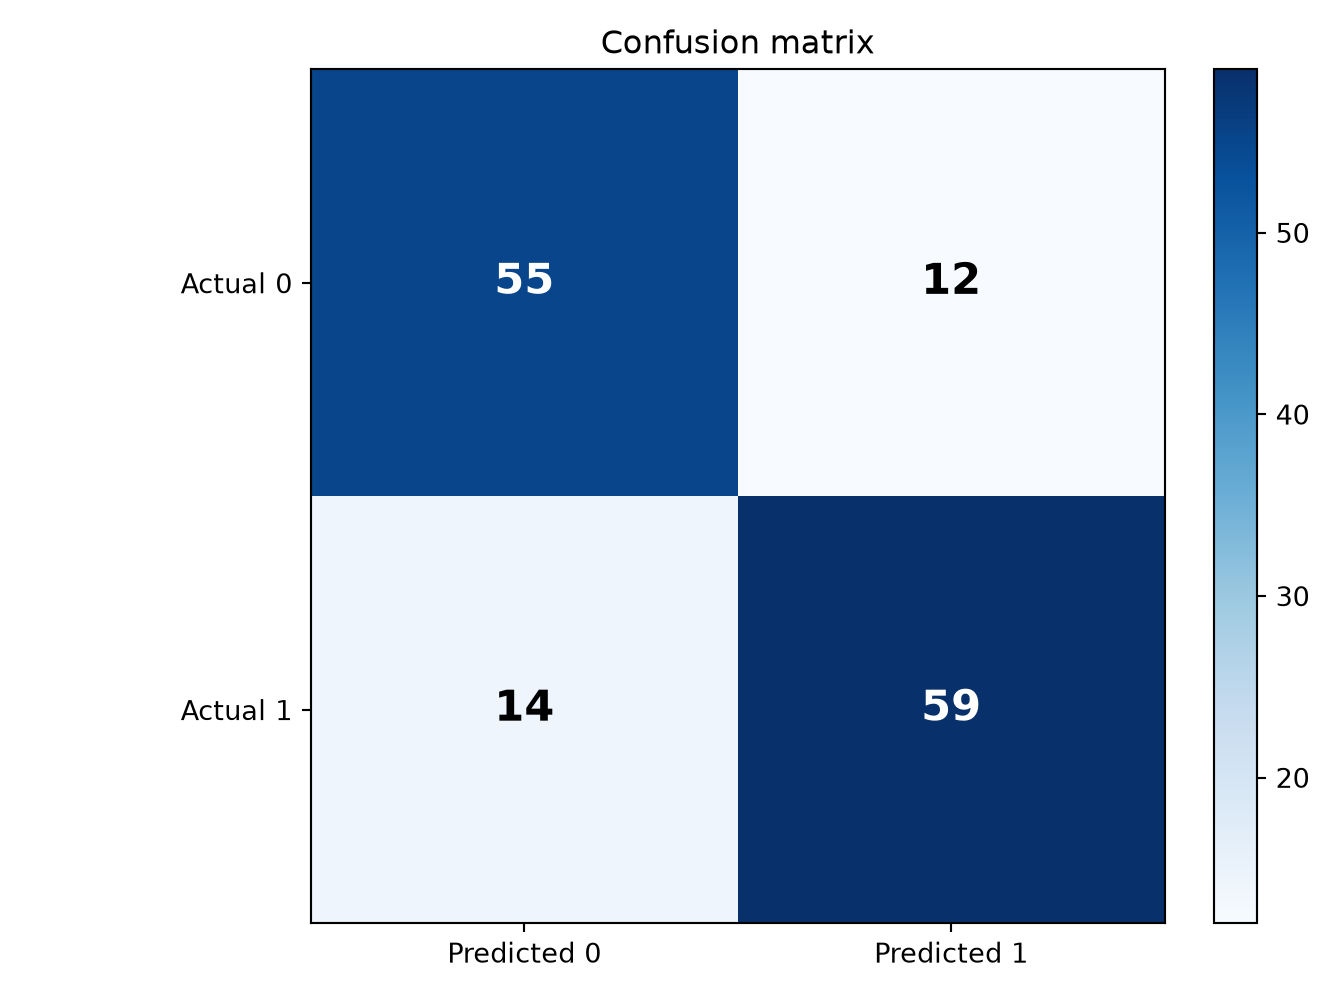
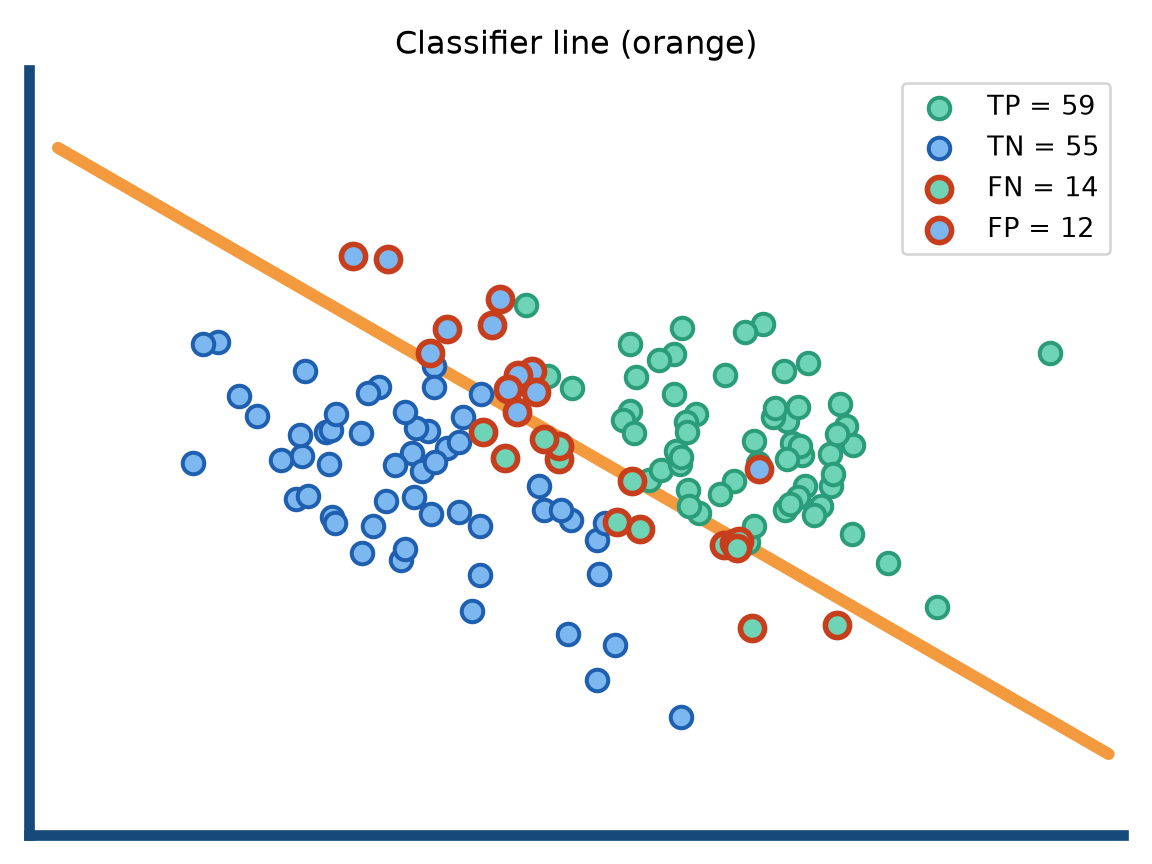
Comparing predicted vs. actual class labels allows us to evaluate the performance of a classifier like logistic regression.
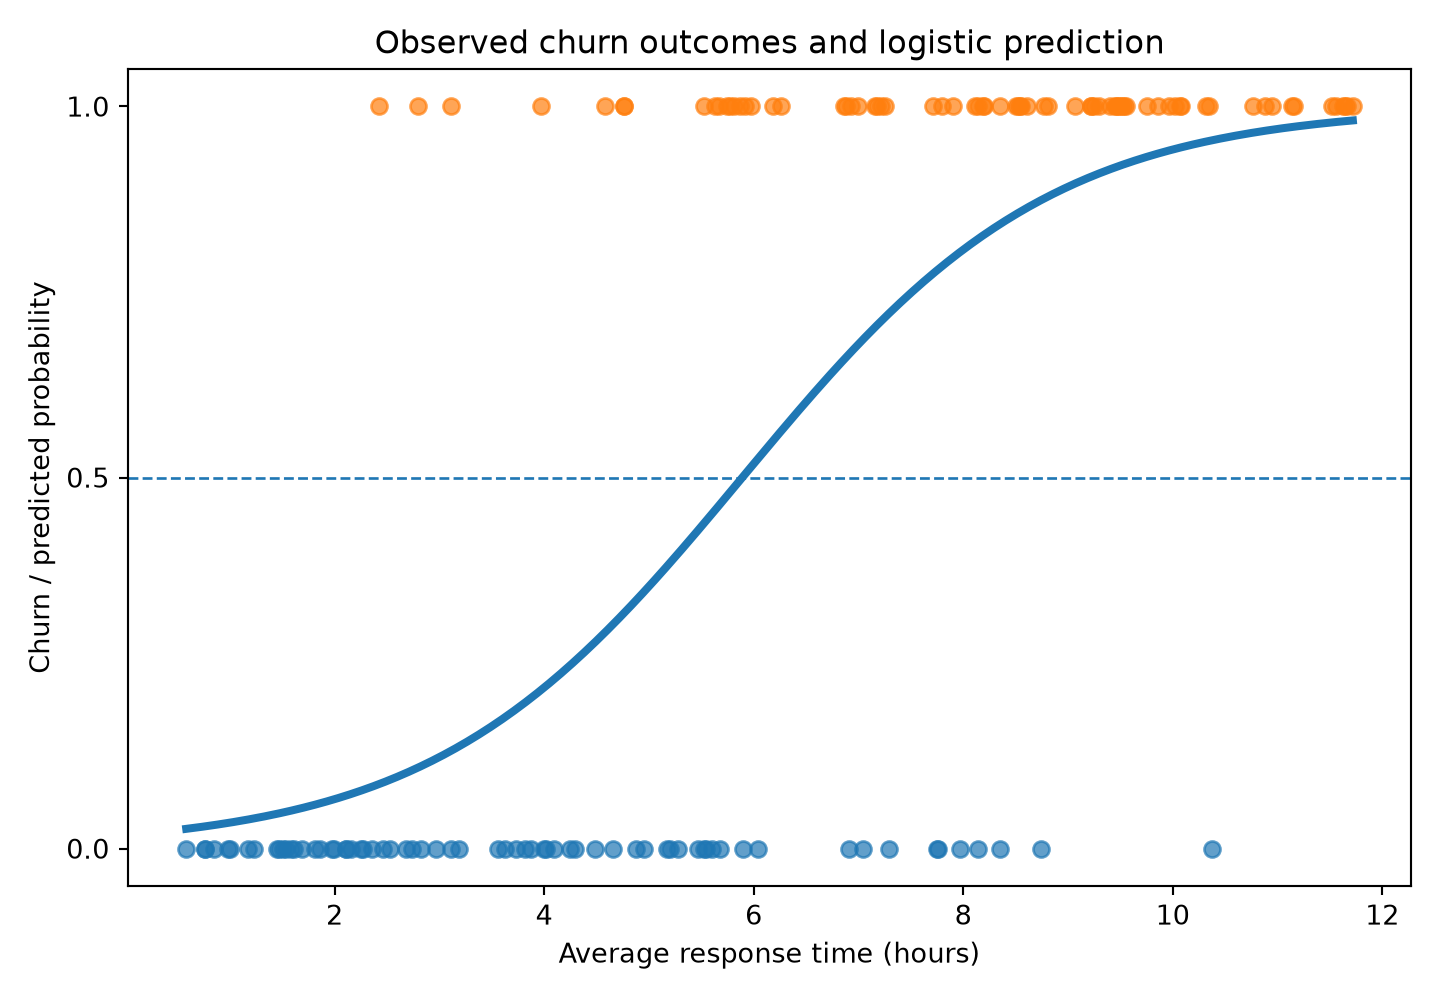
Using a 0.5 threshold, predicted probabilities are turned into classes.
The confusion matrix summarizes:
| Metric | Formula | Interpretation |
|---|---|---|
| Accuracy | \(\frac{TP+TN}{TP+TN+FP+FN}\) | Overall share of correct predictions |
| Precision | \(\frac{TP}{TP+FP}\) | Among predicted positives, how many are actually positive? |
| Recall | \(\frac{TP}{TP+FN}\) | Among actual positives, how many did the model identify? |
| F1 | \(2\cdot\frac{\text{Precision}\cdot\text{Recall}}{\text{Precision}+\text{Recall}}\) | Balance between precision and recall |
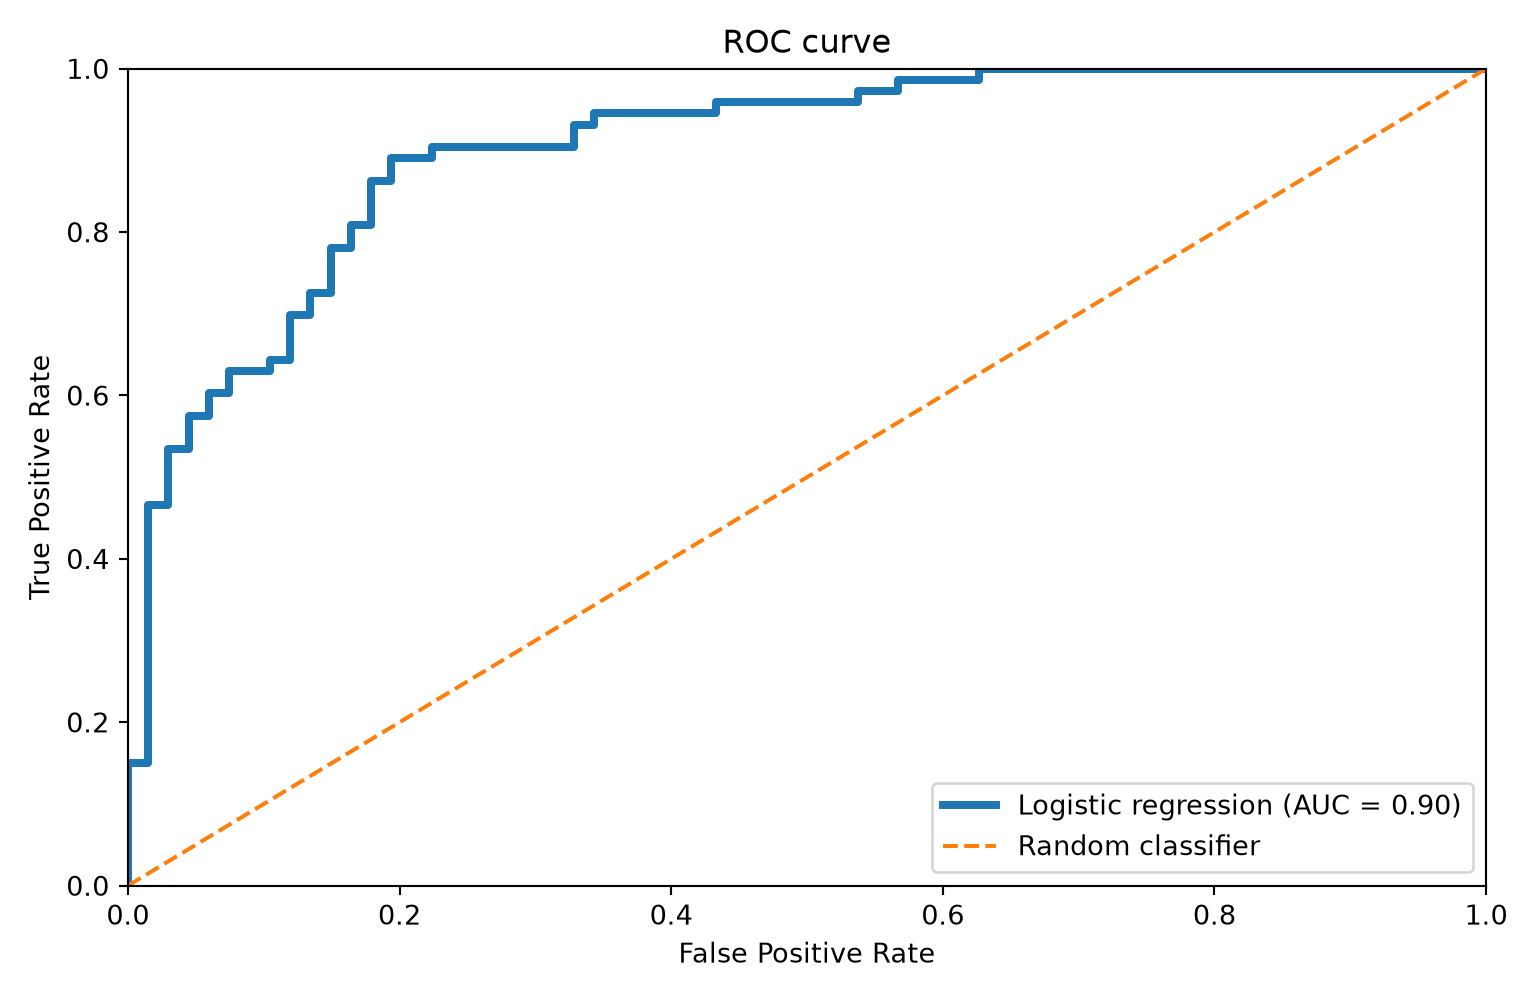
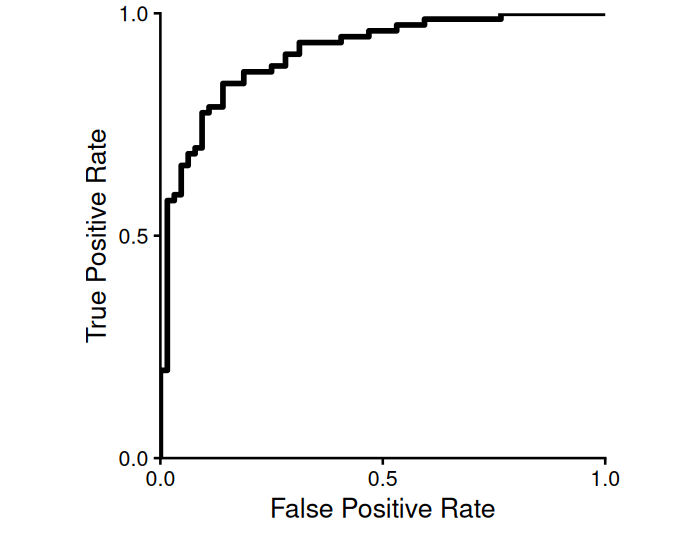
The Receiver Operating Characteristic (ROC) curve summarizes the trade-off between:
As we vary the classification threshold, the model becomes more or less conservative in predicting churn = 1.
Area under the curve (AUC) summarizes ROC performance in a single number:
A good classifier achieves:
→ Curves closer to the top-left corner indicate better model fit.
Calculate ROC and AUC
roc() work?function roc(actual, scores, levels, direction):
# Identify actual positive and negative cases
negative = actual == levels[0]
positive = actual == levels[1]
for threshold in thresholds(scores):
# direction specifies the ordering of ground-truth scores
# "<": negatives have lower scores than positives
# ">": negatives have higher scores than positives
if direction == "<":
predicted = scores >= threshold
else:
predicted = scores <= threshold
# Evaluate predictions against actual outcomes and store in roc_object
TP = count(predicted & positive)
FP = count(predicted & negative)
TPR = TP / count(positive)
FPR = FP / count(negative)
return roc_object # (containing TPR, FPR, ...)A logistic regression model predicts a probability of churn:
\[ p(x) = P(\text{churn}=1 \mid x) \]
This probability is based on historical data, reflecting how similar customers behaved in the past, and capturing a baseline churn risk. It is not a certainty.
Suppose a firm has two possible actions:
So the business problem is no longer only:
Who is likely to churn?
It becomes:
For whom is an intervention worth it?
We can use the expected value criterion to translate predictions into decisions by combining:
A simple payoff structure:
| Action | Customer would churn | Customer would stay |
|---|---|---|
| Intervene | +20 | -10 |
| Do nothing | -100 | 0 |
Interpretation:
| Action | Customer would churn | Customer would stay |
|---|---|---|
| Intervene | +20 | -10 |
| Do nothing | -100 | 0 |
Probabilities:
If we intervene, the expected value is:
\[EV(intervene) = p(x)\cdot 20 + (1-p(x))\cdot (-10) = 30p(x) - 10\]
If we do nothing, the expected value is:
\[ EV(do\_nothing) = p(x)\cdot (-100) + (1-p(x))\cdot 0 = -100p(x) \]
Instead of selecting one action, we should intervene whenever:
\[ EV(intervene) > EV(do\_nothing) \]
Insert the expected values:
\[ 30p(x) - 10 > -100p(x) \]
Simplify:
\[ 130p(x) > 10 \]
\[ p(x) > 0.077 \]
This gives a clear rule:
Intervene if \(p(x) > 0.077\) (if predicted churn probability exceeds 7.7%).
The threshold is low because:
So even a small churn probability can justify action.
This decision combines two complementary inputs:
1. Data-driven component
Logistic regression estimates: \[ p(x)=P(\text{churn}=1\mid x) \]
Learned from historical data
Provides a probability (what is likely to happen)
2. Business-driven component
Please take 1–2 minutes to reflect on today's session.