Describe variables, relationships between variables, and underlying structure in the data (e.g., clusters).
Explore data sets using appropriate descriptive and visual techniques.
Explain the role of exploratory data analysis in business decision-making.
Foundations
People are not very good at looking at a column of numbers or a whole data table and then determining important characteristics of the data. EDA techniques have been devised as an aid in this situation.
The following forms of EDA are typically distinguished:
Univariate
Multivariate
Non-graphical
mean, median frequencies
cross-tabs correlations
Graphical
histograms dot plots
scatter plots clustering
Univariate exploratory data analysis
Descriptive statistics
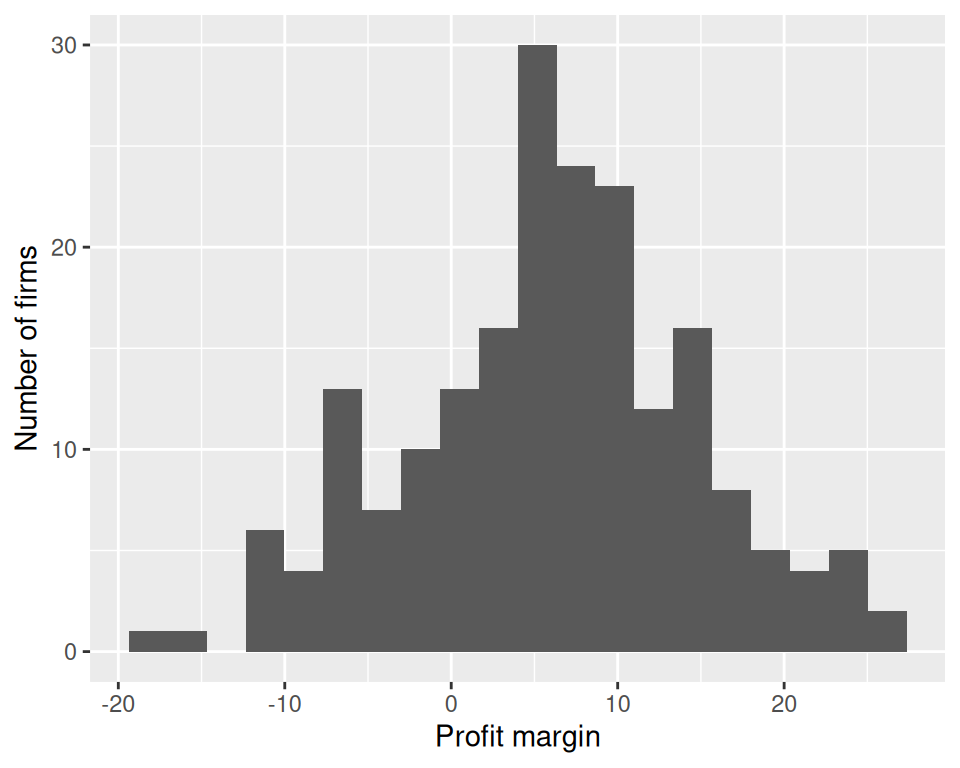
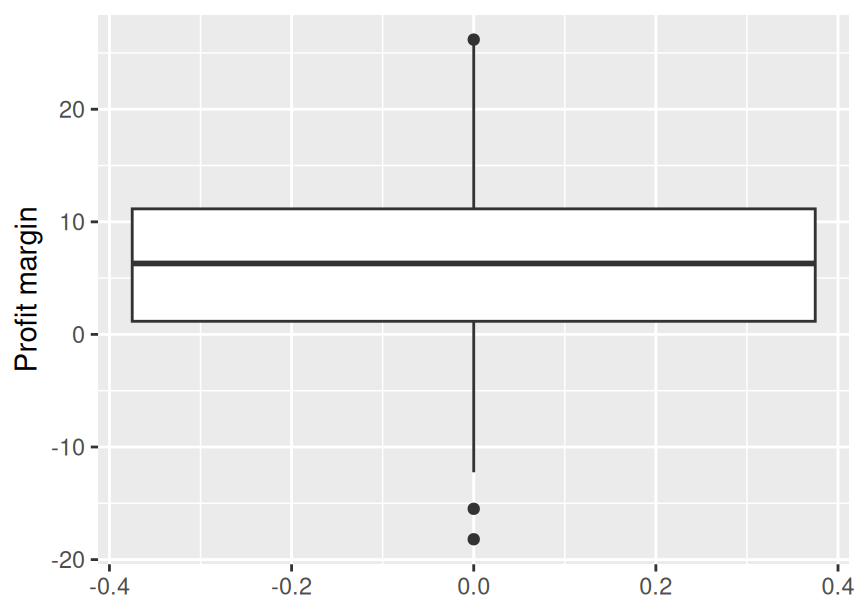
We use one real data set throughout the examples: 200 firms from four sectors.
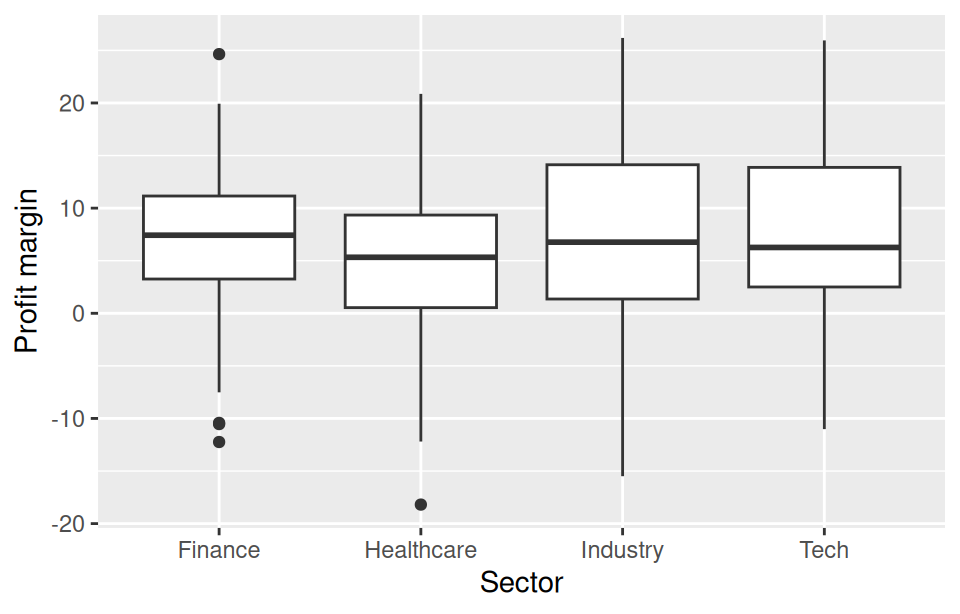
Boxplots can be used to compare different distributions
The same summary can be calculated for each category.
Observation: Industry and Tech have wider interquartile ranges than Finance. Finance has the highest median profit margin and several potential outliers.
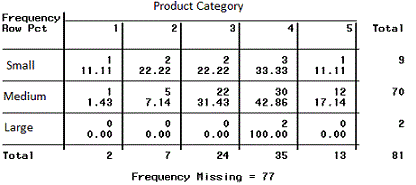
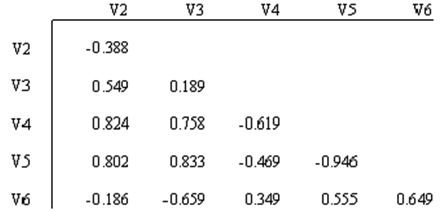
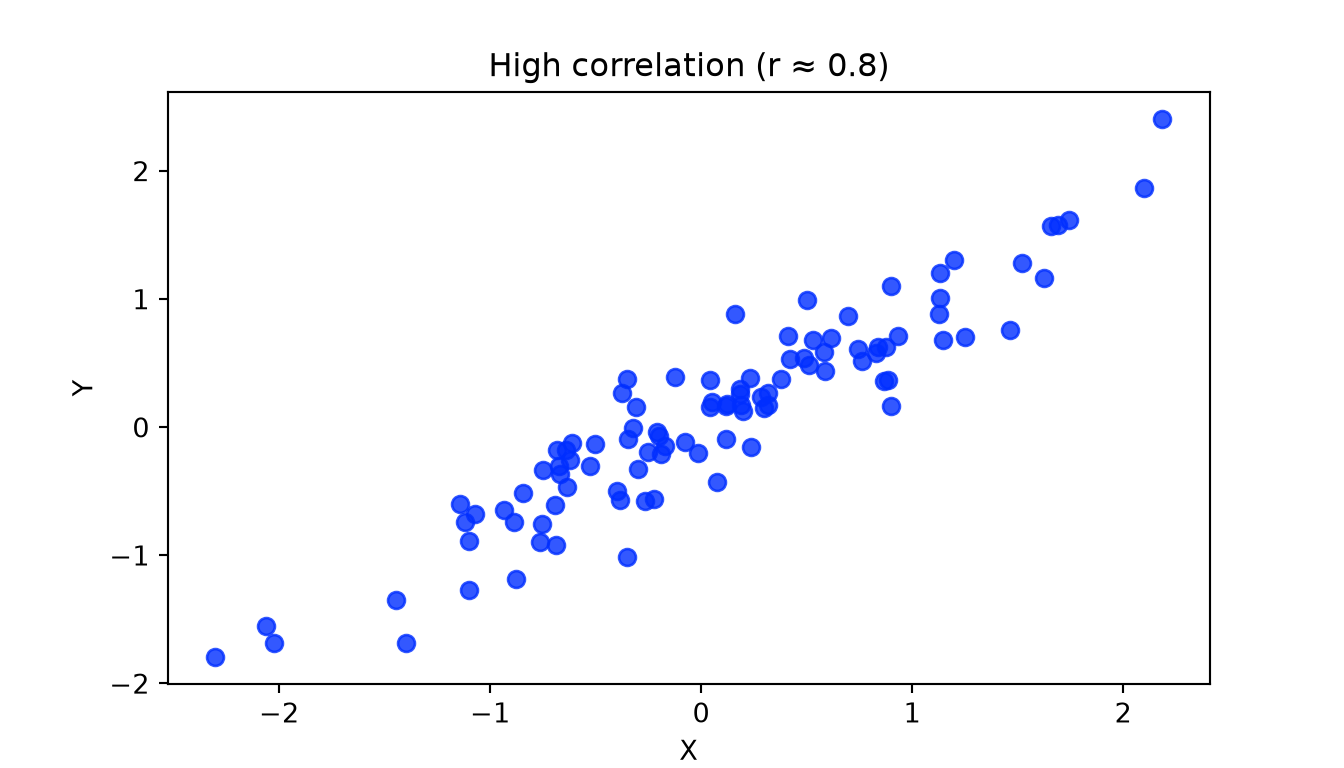
Multivariate non-graphical EDA techniques generally show the relationship between two or more variables in the form of either cross-tabulation for categorical variables or correlation statistics for numerical variables.
Multivariate graphical EDA
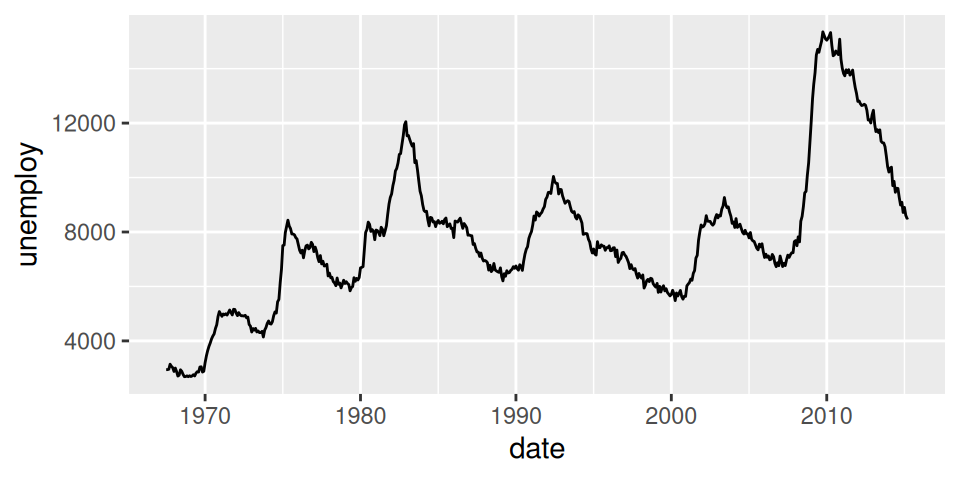
When exploring multiple variables together, the appropriate visualization depends on the types of variables being compared.
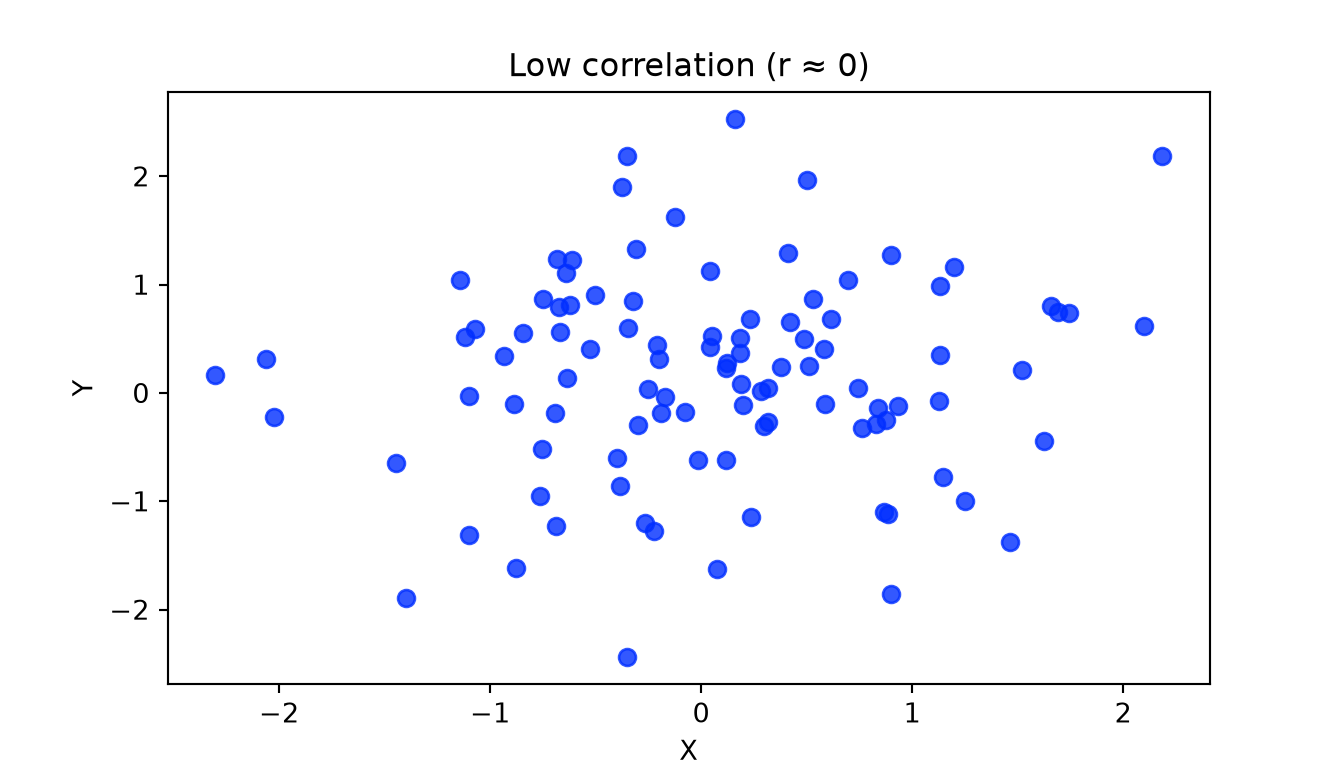
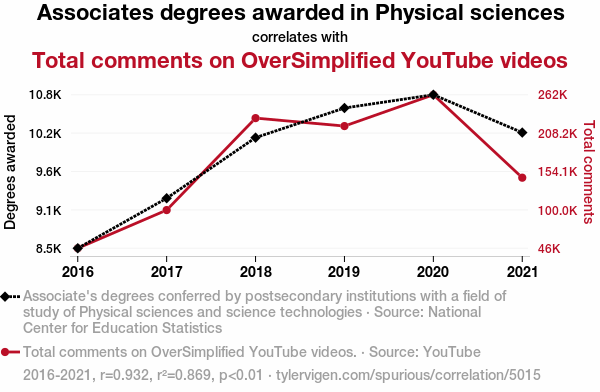
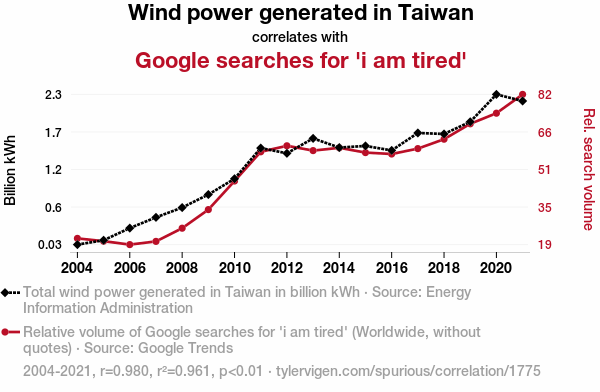
Bivariate correlations are often insufficient for prediction or explanation, requiring more powerful analytical models.
If causal explanations are unavailable, decisions may need to rely on predictions.
Clustering in EDA
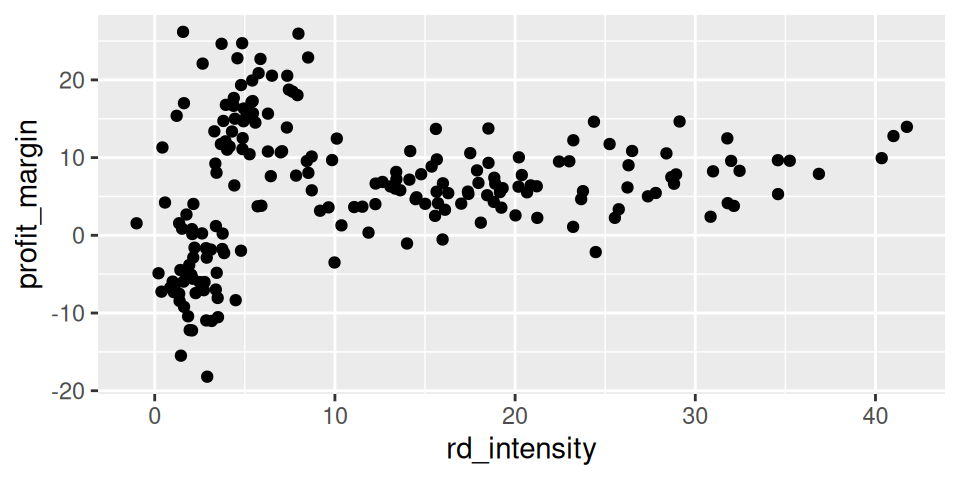
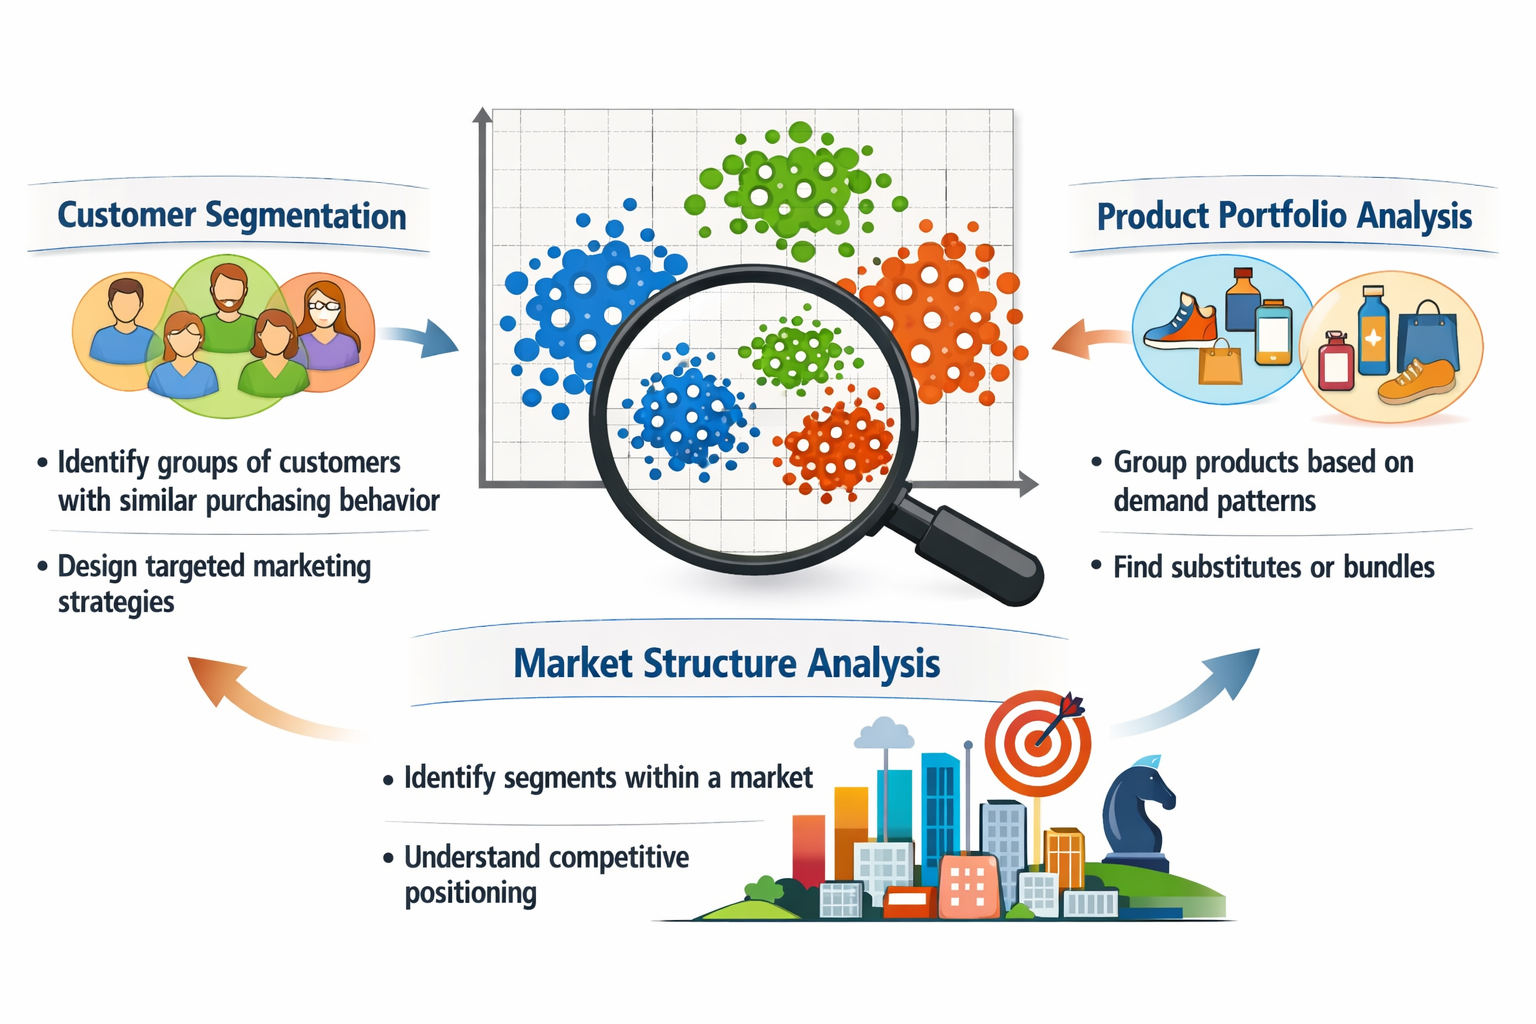
In multivariate exploratory data analysis, we often want to understand whether observations form natural groups.
Clustering is an EDA technique that groups similar observations based on their characteristics.
Common use cases include:
Families of clustering methods
Clustering algorithms can be grouped into several families of approaches.
Family
Examples
Key characteristics
Partitioning methods
k-means, k-medoids (PAM), bisecting k-means
divide observations into a predefined number k of clusters; k-means is computationally efficient and widely used for business/customer segmentation
Hierarchical methods
Agglomerative clustering, divisive clustering
clusters formed through successive merging or splitting; produce dendrograms (cluster trees); useful for exploratory structure discovery
Density-based methods
DBSCAN, HDBSCAN
clusters defined as regions of high density; identify arbitrary shapes and outliers/noise
Probabilistic / model-based methods
Gaussian mixture models
clusters modeled as probability distributions; allow soft cluster membership when groups overlap
In this lecture we focus on k-means (segmentation) and agglomerative hierarchical clustering.
Segmentation clustering
Segmentation methods divide observations into k clusters.
Goal:
maximize similarity within clusters
maximize differences between clusters
The most widely used algorithm:
k-means clustering
Key assumption:
clusters are roughly spherical and similar in size.
k-means: The algorithm
For a given k, the algorithm finds cluster centers that minimize within-cluster sum of squares.
Steps:
Randomly assign data points to k clustersRepeat: calculate centroids for each clusterfor each data point: compute distance to all centroidsif x is not closest to its current centroid: assign x to the nearest centroidif centroids and cluster assignments no longer change: stop
Strengths: fast and scalable, easy to interpret
Limitations: must choose k, sensitive to scaling and outliers.
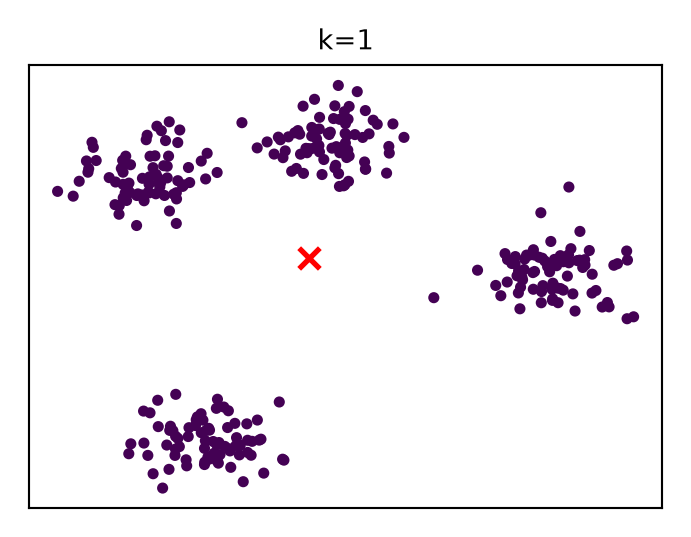
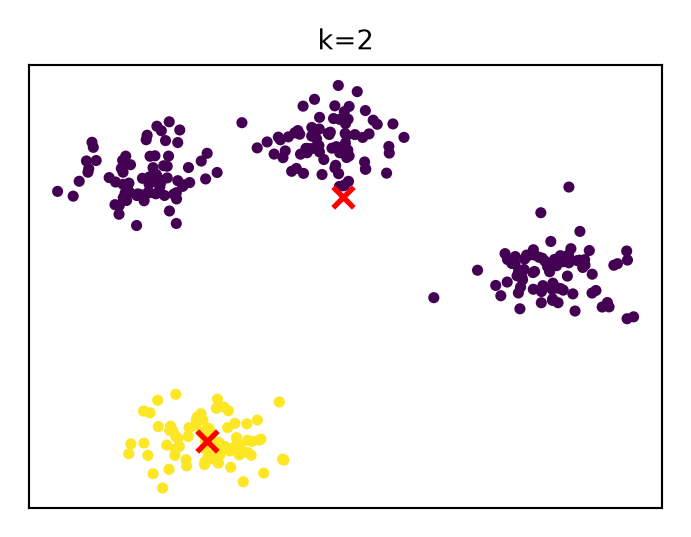
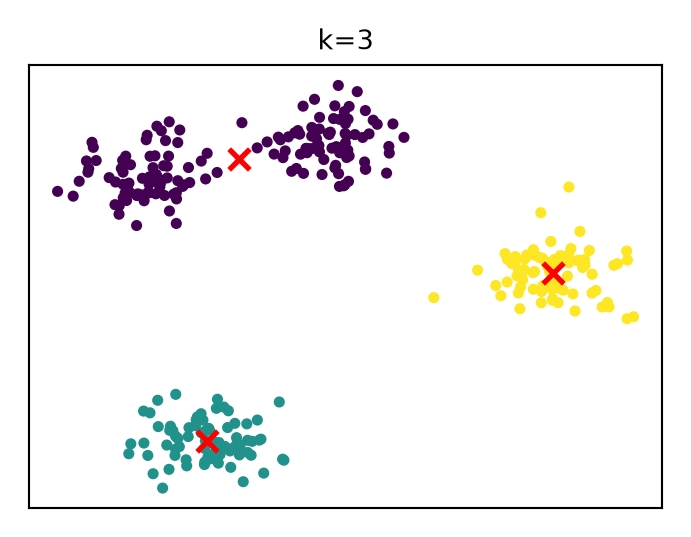
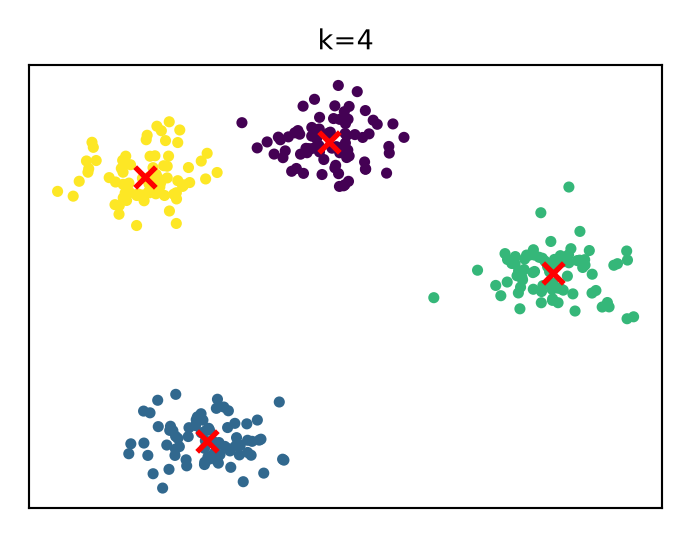
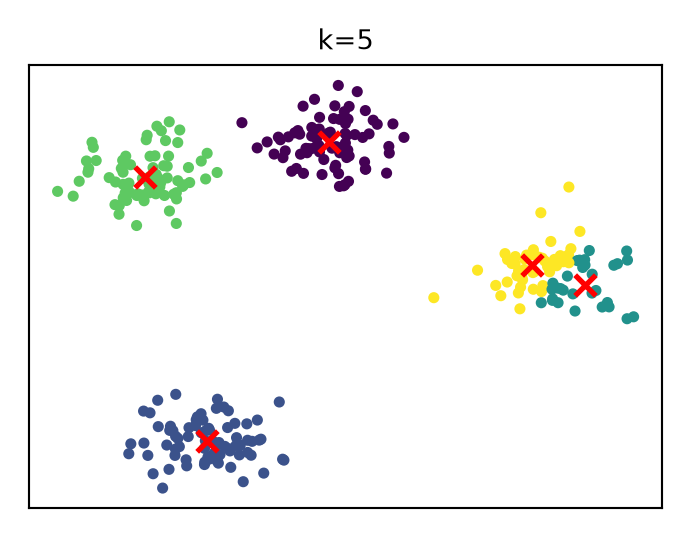
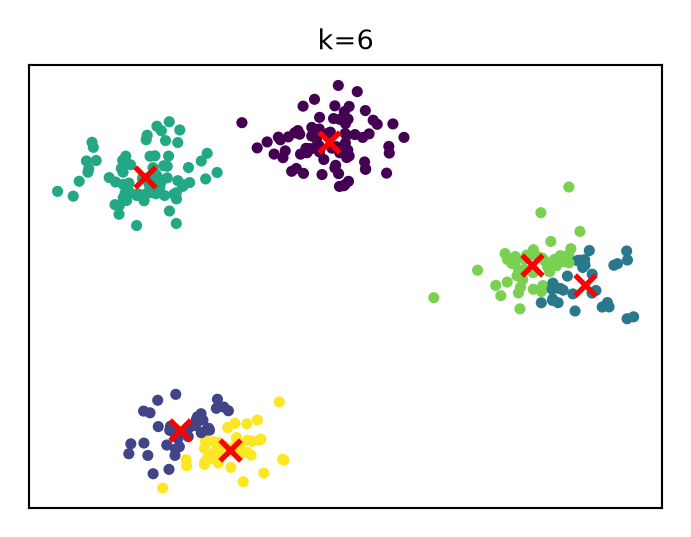
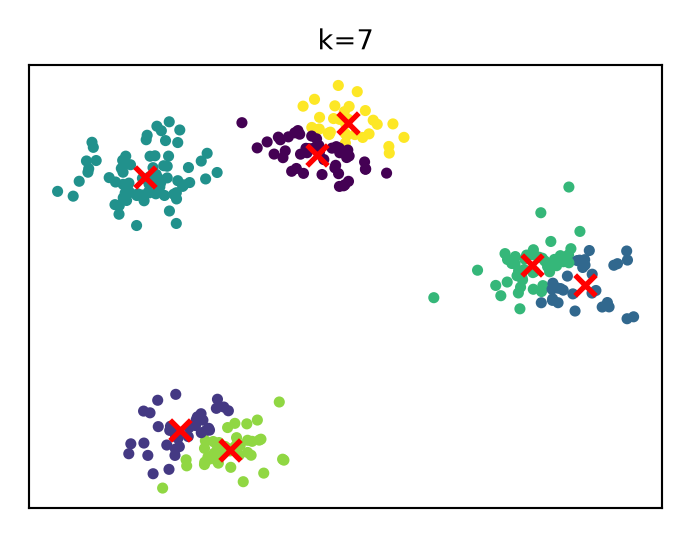
k-means: Comparison of solutions for different k
…
k-means: Implementation in R
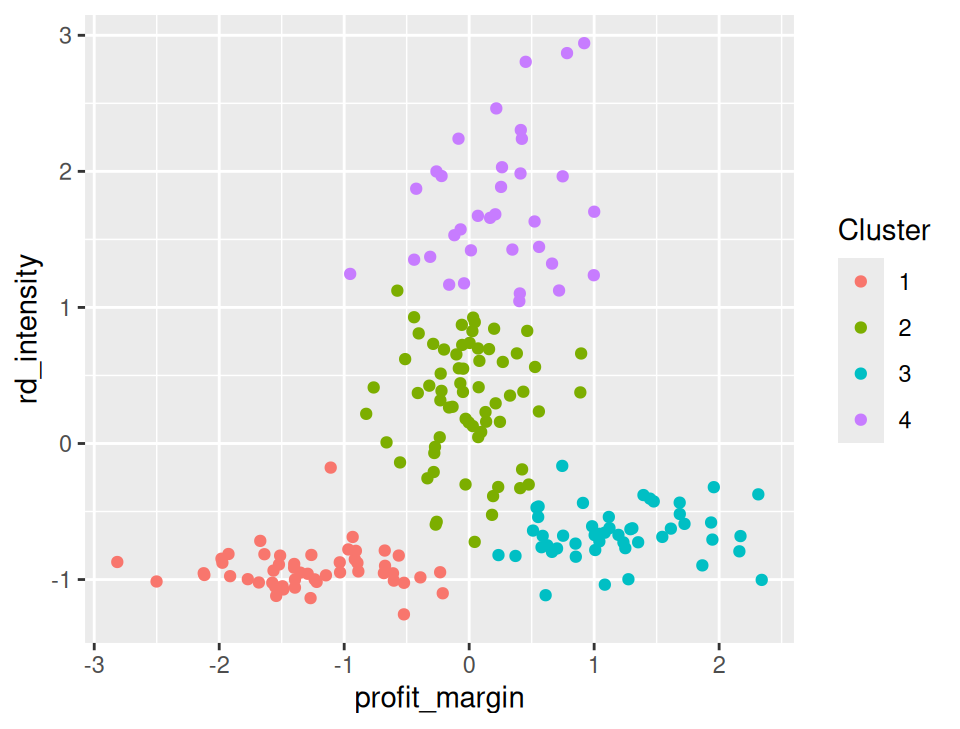
set.seed(42) # for reproducibilityX <- firm_data_df |>select(profit_margin, rd_intensity) |>scale()km <-kmeans(X, centers =4, nstart =25)as.data.frame(X) |>mutate(cluster =factor(km$cluster)) |>ggplot(aes(x = profit_margin, y = rd_intensity, color = cluster)) +geom_point() +labs(color ="Cluster")
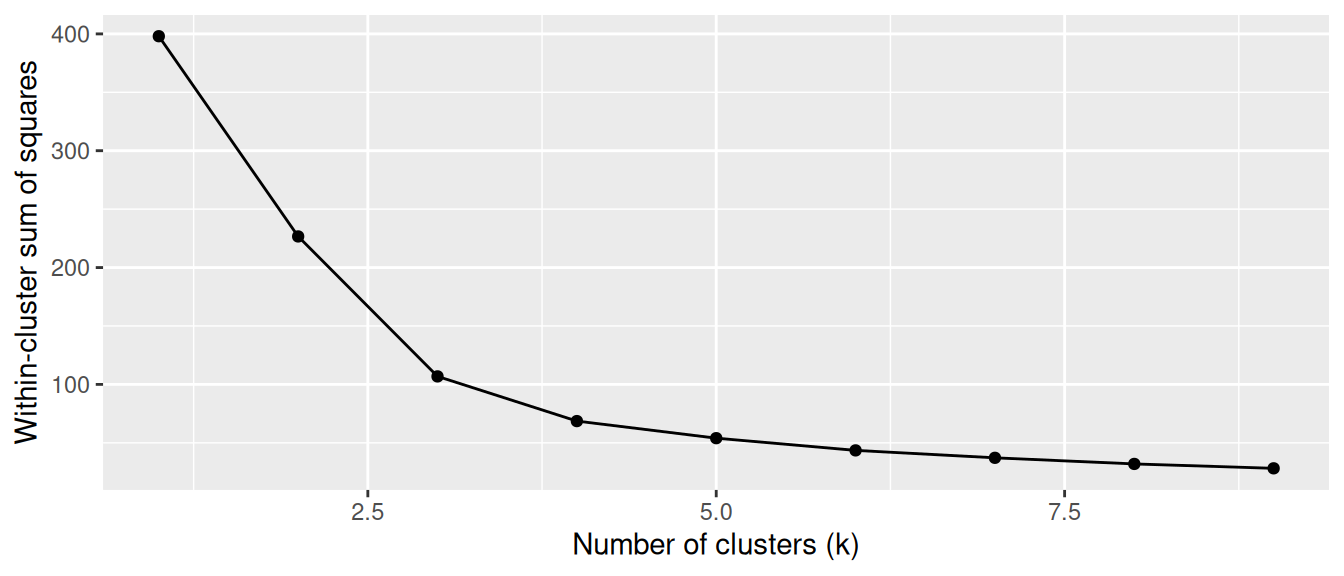
k-means: Choosing the number of clusters (I)
A common heuristic is the elbow method.
Idea:
increase k
measure improvement in model fit
look for point where improvement slows
Example metric: within-cluster variance (inertia)
Choose k at the “elbow” (diminishing returns)
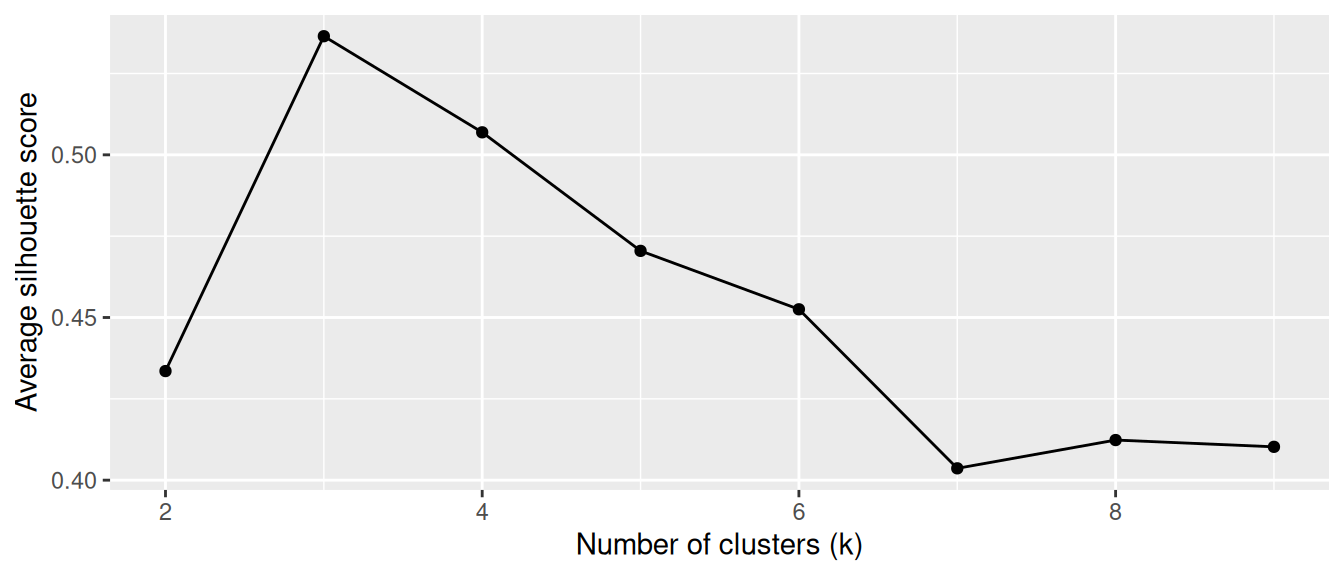
k-means: Choosing the number of clusters (II)
An alternative is the silhouette score.
Idea:
evaluate cohesion (within clusters)
evaluate separation (between clusters)
combine both into a single score
Choose k that maximizes the score
Higher = better separation and compactness
Hierarchical clustering
Hierarchical clustering builds a tree of clusters.
There are two types of hierarchical cluster methods:
Agglomerative hierarchical clustering is a bottom-up clustering method. It starts with every single data object in a single cluster. Then, in each iteration, it agglomerates (merges) the closest pair of clusters by satisfying some similarity criteria, until all the data is in one cluster.
Divisive hierarchical clustering is a top-down clustering method. It works similarly to agglomerative clustering but in the opposite direction. This method starts with a single cluster containing all data objects, and then successively splits resulting clusters until only clusters of individual data objects remain.
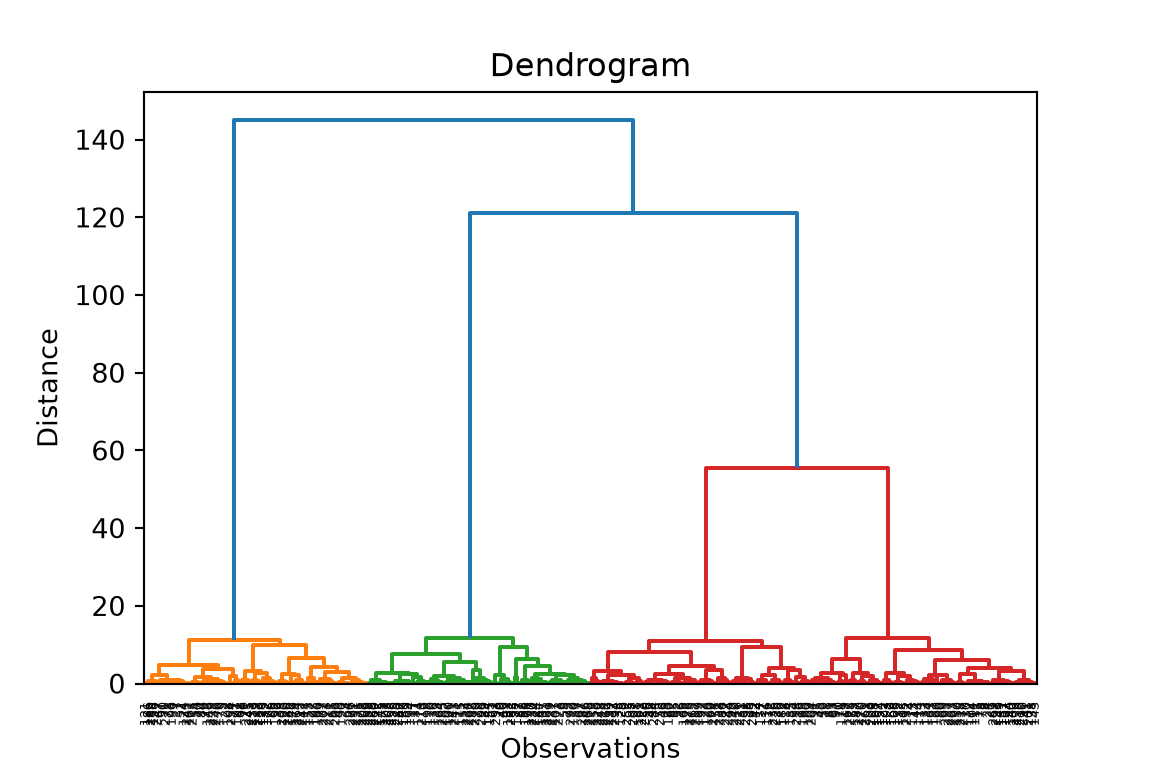
Dendrogram
A dendrogram is a tree diagram frequently used to illustrate the arrangement of the clusters produced by hierarchical clustering. The y-axis represents the value of this distance metric (e.g. Euclidean distance) between the clusters.
In a dendrogram the widths of the horizontal lines give an impression about the dissimilarity of the merging object. Thus, a good cluster number might be at a point from where the width of the following horizontal lines is significantly shorter.
This allows us to explore clusters at multiple levels of granularity.
Evaluation of clusters
⚠ Clustering algorithms will always produce groups, even when no meaningful structure exists.
Therefore, clusters must be evaluated.
Common evaluation approaches include:
internal validation
silhouette score
cluster stability
external validation
compare with known labels or metadata
interpretability checks
do cluster profiles make sense in the given context?
Why clustering is useful in analytics workflows
Clustering often supports later analytical steps.
For example:
Customer segments in data warehouses
segments stored as features for reporting or dashboards
Heterogeneity in regression models
different segments may follow different behavioral patterns
subgroup analysis or separate models
Machine learning pipelines
clustering can generate features or latent groups
Hypothesis generation and model development
clusters can reveal previously unnoticed patterns or structures
these patterns may suggest new hypotheses about behavior or relationships in the data
clustering can therefore inform model specification, variable selection, or interaction terms
Summary
Exploratory Data Analysis (EDA) helps us understand data before modeling.
Balijepally, VenuGopal, George Mangalaraj, and Kishen Iyengar. 2011. “Are We Wielding This Hammer Correctly? A Reflective Review of the Application of Cluster Analysis in Information Systems Research.”Journal of the Association for Information Systems 12 (5): 1. https://doi.org/10.17705/1JAIS.00266.