Machine Learning for Big Data
Session 2 | 2026-09-04
Modern machine learning and AI for big data became powerful through three mutually reinforcing developments:
The rapid acceleration of computing power—driven by advances in hardware, cloud infrastructure, and parallel processing—has enabled modern analytics and machine learning to scale to massive datasets.
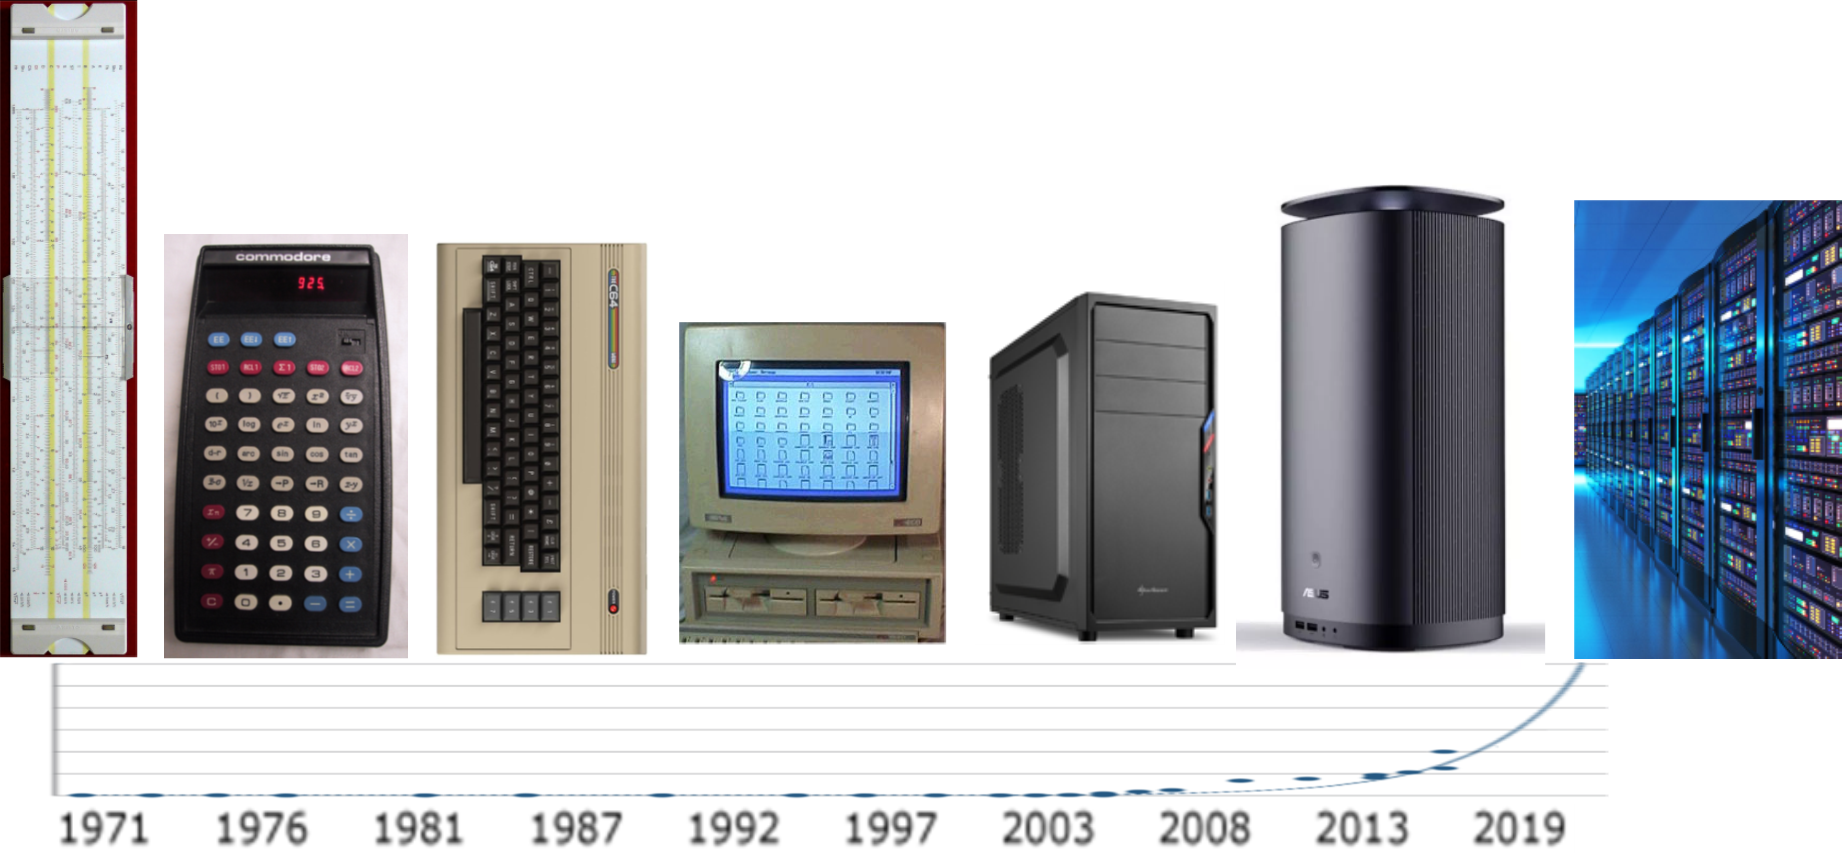
The growth of modern analytics is enabled by changing strategies for increasing computing power.
| Era | Main strategy | Explanation |
|---|---|---|
| 1970s–2000s (*) | Moore’s Law & miniaturization | Smaller transistors → more components per chip → faster processors |
| 2005–today | Parallel computing | Performance increases by using multiple processors simultaneously |
| 2010s–today | Specialized hardware | Chips optimized for specific workloads (GPUs, TPUs, AI accelerators) |
| Emerging | New computing paradigms | Alternative computing models such as quantum computing |
An algorithm is a step-by-step procedure for performing a computation and thereby solving a problem.
Algorithms determine which problems computers can solve and how efficiently they can solve them.
Examples:

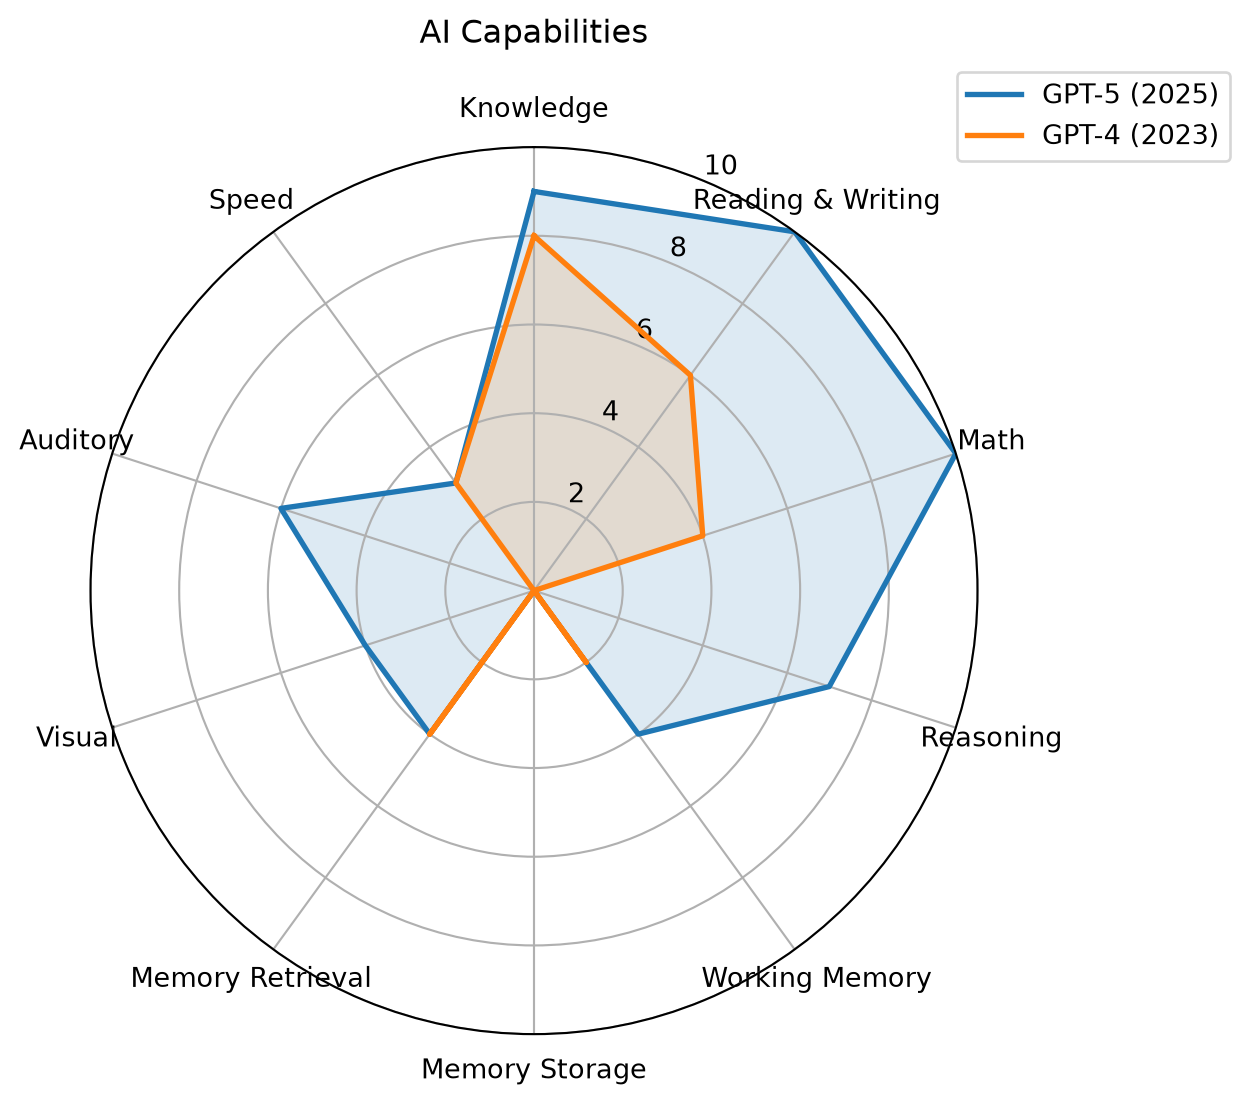
Traditional Regression

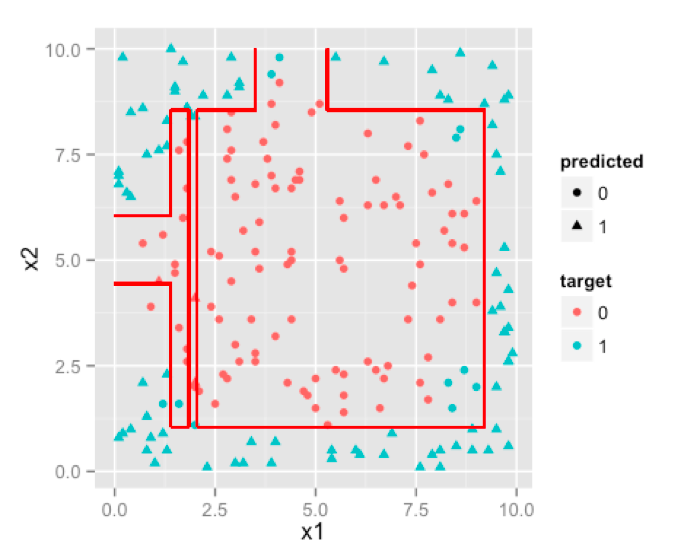
Decision Tree
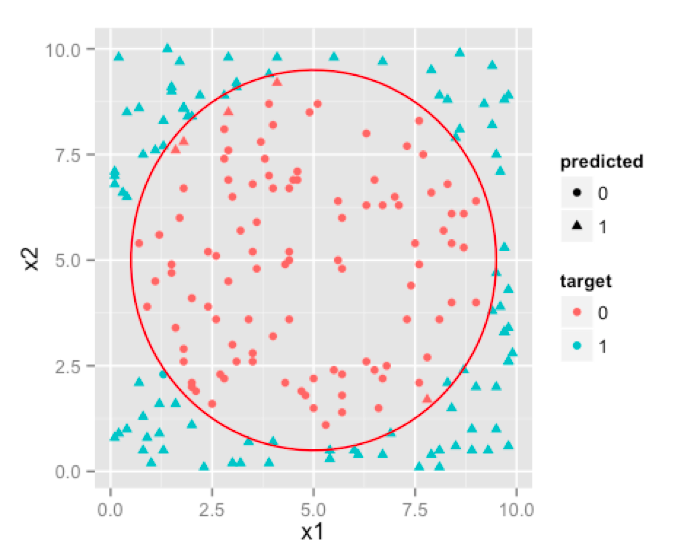
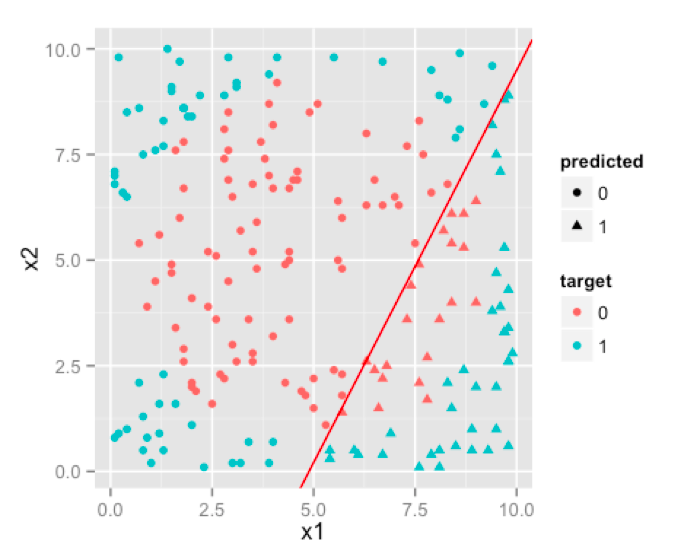
Neural Network
There is a broad repertoire of models and methods from multiple disciplines, each with its own assumptions, data preparation steps, and modeling processes. While these fields often focus on methodological development, business analytics emphasizes applying these approaches to support understanding and decision-making in organizational contexts.
| Discipline | Model culture | Typical models |
|---|---|---|
| Statistics | Probabilistic inference | Regression, GLM, Bayesian |
| Econometrics | Causal modeling | IV, panel models |
| Computer Science | Algorithmic learning | Trees, SVM, NN |
| Operations Research | Optimization | Linear programming, Non-linear optimization |
| Management Science | Decision modeling | Stochastic optimization |
| Complex Systems | Simulation | Agent-Based/Discrete Event Simulation |
Breakthroughs in artificial intelligence (AI)1 show how new algorithms can rapidly surpass human performance. DeepMind provides good examples.
AlphaGo (2016)
Go was long considered too complex for computers due to the enormous search space.

AlphaFold (2020–2022)
Predicting protein folding had been a major unsolved problem in biology for decades.
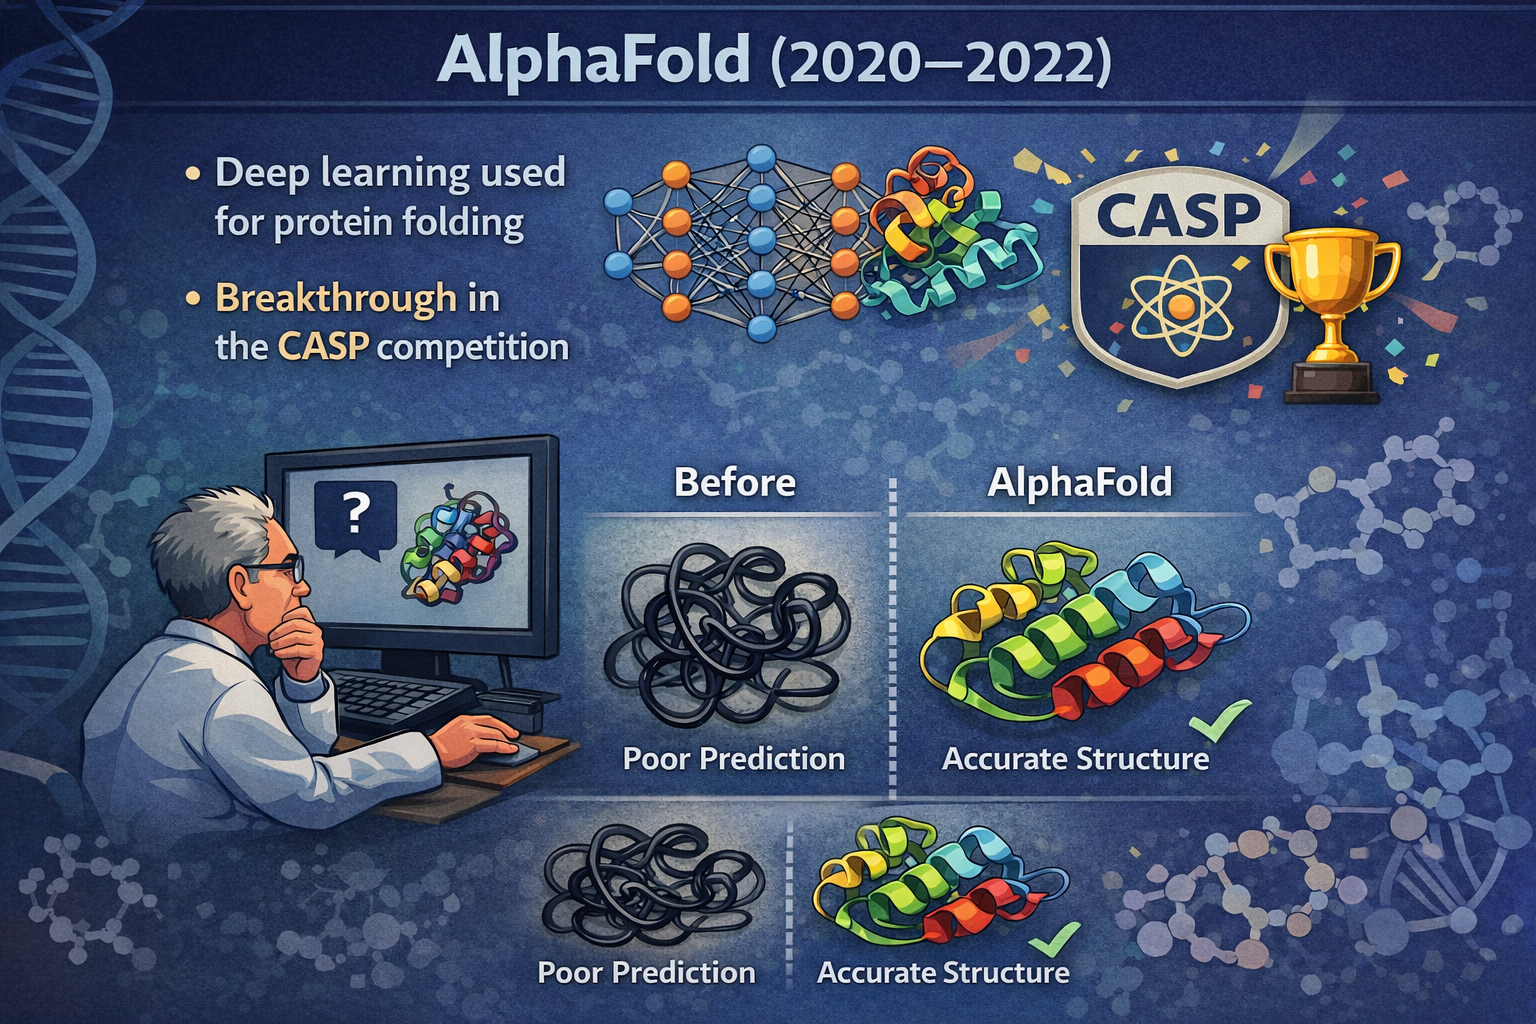

AI progress often occurs through algorithmic breakthroughs, enabling machines to outperform humans in increasingly complex tasks.
Recent studies suggest that AI creates a “jagged frontier.” (Dell’Acqua et al. 2023), i.e., some tasks are well suited to AI, while others that appear similar remain outside its capabilities.
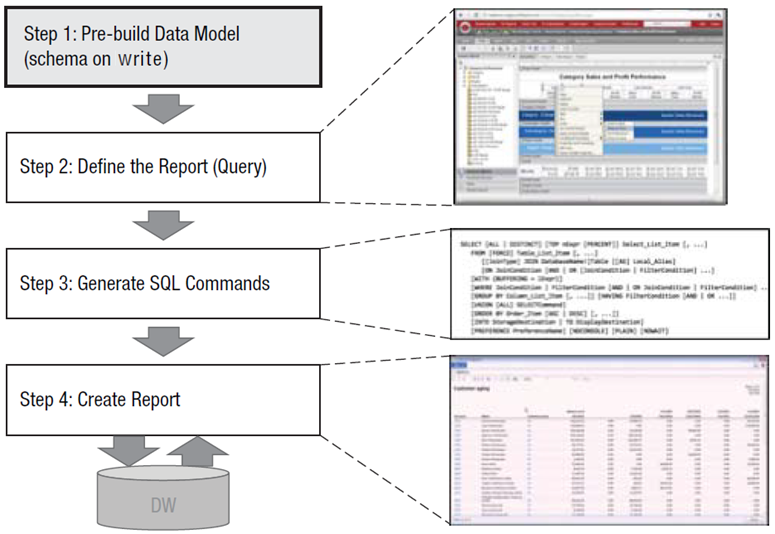
Data architectures have evolved as organizations seek to support more diverse data and increasingly advanced analytics.
Data warehouse
Data lake / lakehouse
Federated architectures
AI-ready architecture
➡ Architectural evolution reflects changing business trade-offs:
consistency → flexibility → decentralization → AI integration
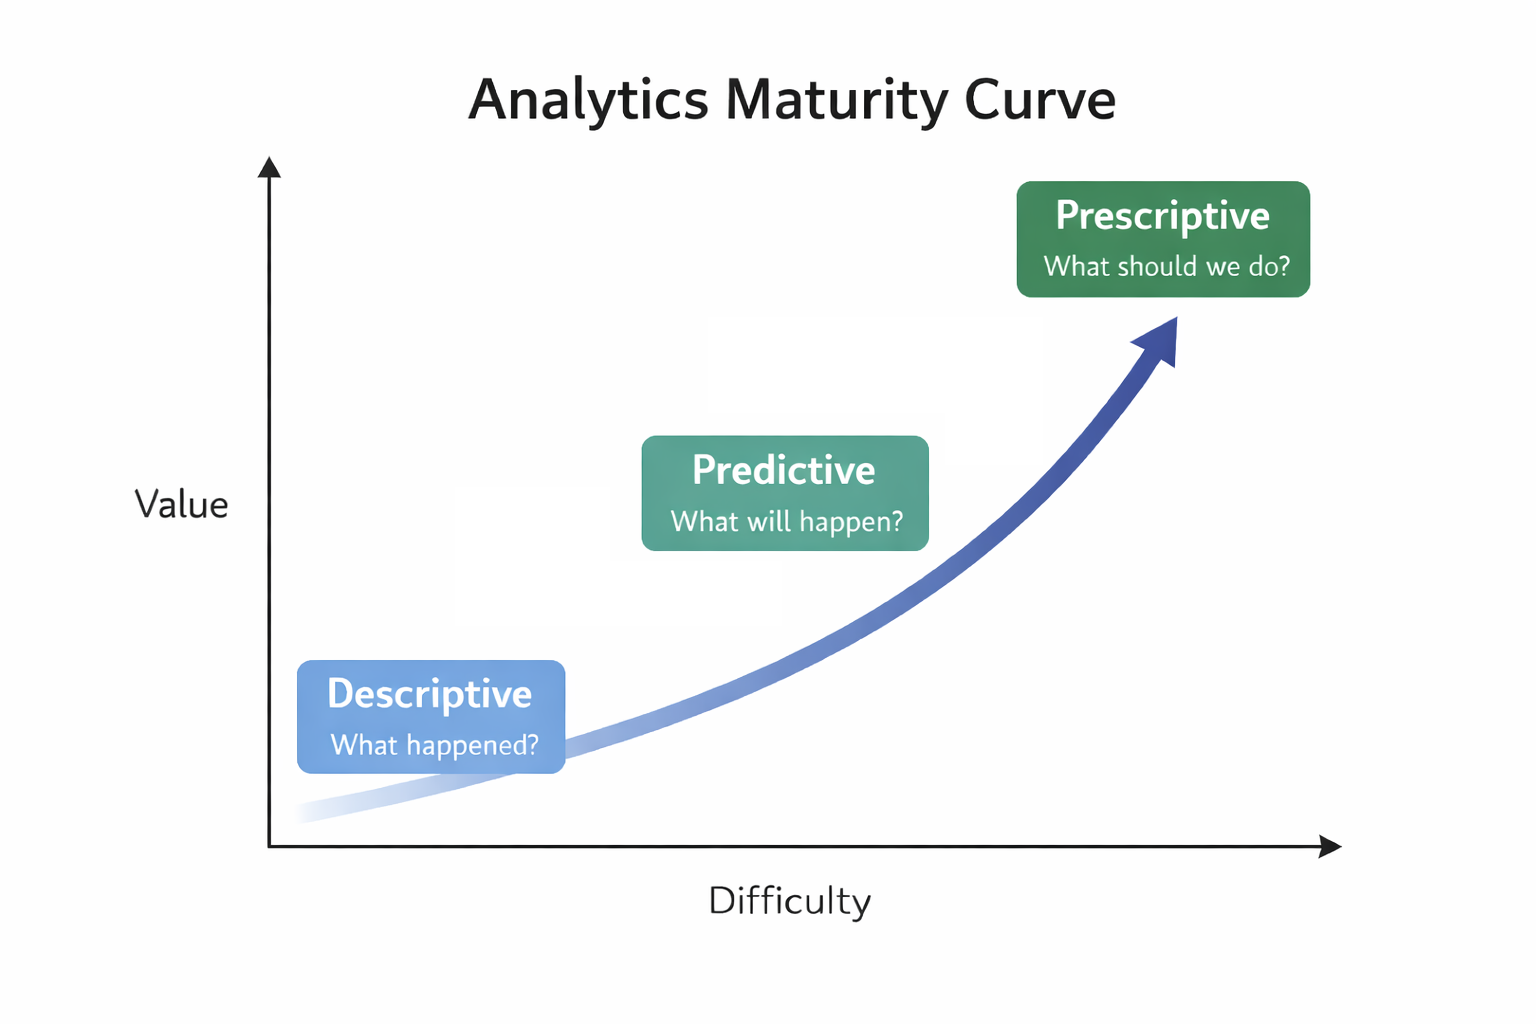
Descriptive analytics: What happened?
Predictive analytics: What will happen?
Prescriptive analytics: What should we do?
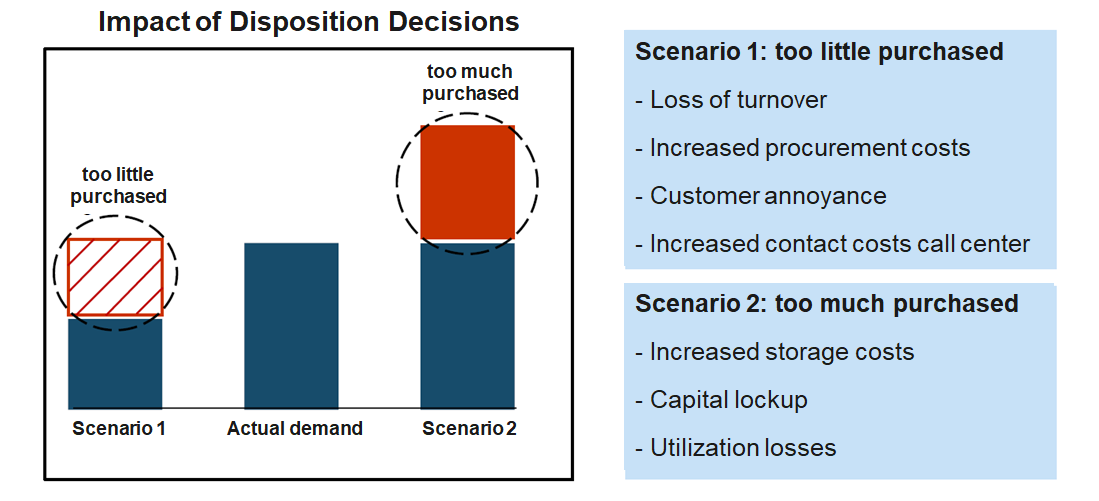
Based on more than 300 million data records per week, Otto generates over one billion forecasts annually on the expected sales of individual products in the coming days and weeks. These forecasts are used to optimize inventory decisions, determining how many units of each product should be stocked or reordered across warehouses. By systematically adjusting inventory levels based on these data-driven recommendations, Otto is able to reduce its overall inventories by up to 30% on average while maintaining product availability.
Classify each question or statement as descriptive, predictive, or prescriptive analytics.
| Business question / statement | Analytical purpose |
|---|---|
| How many customers cancelled their subscriptions last month? | |
| Which customers are likely to cancel their subscriptions next month? | |
| Offer a 15% discount to customers with a high predicted churn risk. | |
| What were our highest-selling products last quarter? | |
| How much demand should we expect for each product next month? | |
| Reorder 5,000 units to minimize the risk of stock-outs. | |
| Which regions had the highest employee turnover last year? | |
| How many employees are likely to leave during the next 12 months? | |
| Increase recruiting capacity by 20% to maintain required staffing levels. |
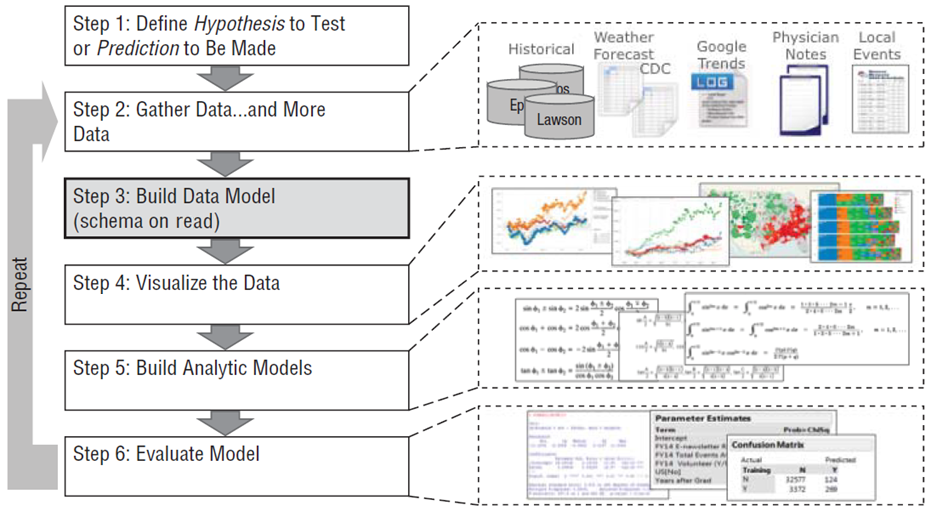
CRISP-DM is a widely used framework that structures data mining and analytics projects (Wirth and Hipp 2000).
Before building analytical models, analysts typically engage in data preparation and exploratory data analysis (EDA).
These activities are closely intertwined and often iterative: we prepare and structure the data while simultaneously exploring it to understand its characteristics and potential issues.
Typical activities include:
Goal: develop an initial understanding of the data, detect patterns or anomalies, and ensure that the data is suitable for further analysis or modeling.
Conducting EDA and representing the “real world” requires us to use appropriate data types. Typically, we distinguish four fundamental data types, known as measurement scales:
Qualitative description of objects
Quantitative description objects
Examples:
Special case of the nominal scale: Binary scale – also called Boolean
Examples:
Values cannot be multiplied or added, even if the numbers belong to the same scale.
Relations between values:
Examples:
Examples:
Examples:
Due to the different mathematical properties, not all statistical measures can be computed on different measurement scales:
| Scale | Mathematical operations possible | Mode | Frequency | Percentiles / Median | Mean / Variance / SD |
|---|---|---|---|---|---|
| Nominal | \(=, \neq\) | X | X | ||
| Ordinal | \(=, \neq, <, >\) | X | X | X | |
| Interval | \(=, \neq, <, >\), linear transformation | X | (X) | X | X |
| Ratio | \(=, \neq, <, >, \times, /, +, -\) | X | (X) | X | X |
(X) The frequency (relative / absolute) may be calculated for a numeric variable, but makes only sense when the number of possible values is low
In business analytics, we rarely work with carefully curated datasets. Instead, data often comes from multiple systems, processes, and teams, where it is primarily created for operational purposes rather than analysis. Because these data sources are not always standardized or under the analyst’s control, quality issues are common:
Before conducting analysis, we must ensure that the data is fit for use (Strong et al. 1997).
Typical data preparation actions
There are many ways to structure the same dataset.
Option A (wide)
| Region | Year | Sales_Q1 | Sales_Q2 | Sales_Q3 | Sales_Q4 |
|---|---|---|---|---|---|
| Europe | 2023 | 120 | 140 | 160 | 150 |
| Asia | 2023 | 100 | 110 | 120 | 130 |
Option B (long)
| Region | Year | Quarter | Sales |
|---|---|---|---|
| Europe | 2023 | Q1 | 120 |
| Europe | 2023 | Q2 | 140 |
| Europe | 2023 | Q3 | 160 |
| Europe | 2023 | Q4 | 150 |
| Asia | 2023 | Q1 | 100 |
| Asia | 2023 | Q2 | 110 |
| Asia | 2023 | Q3 | 120 |
| Asia | 2023 | Q4 | 130 |
➡ Which would you select as an input for a data analytics tool?
→ Solution: Option B, because this is what data analytics tools typically expect.
Data structure typically expected by data analytics tools
Vocabulary
Expected data structure
Dataset df (wide)
| Region | Year | Sales_Q1 | Sales_Q2 | Sales_Q3 | Sales_Q4 |
|---|---|---|---|---|---|
| Europe | 2023 | 120 | 140 | 160 | 150 |
| Asia | 2023 | 100 | 110 | 120 | 130 |
Convert wide → long
Result:
| Region | Year | Quarter | Sales |
|---|---|---|---|
| Europe | 2023 | Sales_Q1 | 120 |
| Asia | 2023 | Sales_Q1 | 100 |
| Europe | 2023 | Sales_Q2 | 140 |
| Asia | 2023 | Sales_Q2 | 110 |
| … | … | … | … |
As a last step, we need to clean the Quarter column by removing the "Sales_" prefix:
Final tidy dataset:
| Region | Year | Quarter | Sales |
|---|---|---|---|
| Europe | 2023 | Q1 | 120 |
| Europe | 2023 | Q2 | 140 |
| Europe | 2023 | Q3 | 160 |
| Europe | 2023 | Q4 | 150 |
| Asia | 2023 | Q1 | 100 |
| Asia | 2023 | Q2 | 110 |
| Asia | 2023 | Q3 | 120 |
| Asia | 2023 | Q4 | 130 |
| Data issue | Example | Data cleansing action |
|---|---|---|
| Missing values | Historical market data missing for some days | Impute values (e.g., interpolate prices), fill with mean/median, or mark as NA |
| Outdated values | Customer moved but old address still stored | Update records from CRM, external address verification service |
| Outliers / implausible values | Age = 250, salary = −5000 | Detect and remove, cap values, or replace with plausible values |
| Inconsistent formats | Dates stored as "03/01/23" and "2023-01-03" |
Standardize to a single format (e.g., ISO date YYYY-MM-DD) |
| Inconsistent units | Revenue in USD and EUR mixed in one column | Convert to common currency |
| Duplicate records | Same customer registered twice | Identify duplicates and merge records |
| Data entry errors | "Munich" vs "Munch" |
Correct spelling using reference tables |
| Sensor errors | Temperature sensor reports 9999 |
Remove invalid values or replace with interpolated measurements |
Organizations often store data in different systems (e.g., CRM, sales systems, web analytics).
Customer database (CRM)
| Customer_ID | Name | Country | |
|---|---|---|---|
| 101 | Alice | Germany | alice@example.com |
| 102 | Bob | France | bob@example.com |
| 103 | Clara | Germany | clara@example.com |
Sales transactions
| Customer_ID | Order_ID | Revenue |
|---|---|---|
| 101 | 5001 | 200 |
| 101 | 5002 | 150 |
| 103 | 5003 | 300 |
For analysis, we can integrate these datasets using the shared key Customer_ID.
This creates a combined dataset that links customer information with sales.
| Customer_ID | Name | Country | Order_ID | Revenue | |
|---|---|---|---|---|---|
| 101 | Alice | Germany | alice@example.com | 5001 | 200 |
| 101 | Alice | Germany | alice@example.com | 5002 | 150 |
| 103 | Clara | Germany | clara@example.com | 5003 | 300 |
Often, the way data is stored determines which mathematical operations are possible.
Example: timestamps stored as strings
| user_id | timestamp |
|---|---|
| 101 | “2025-03-12 14:23:05” |
| 102 | “2025-03-12 18:02:11” |
| 103 | “2025-03-13 09:15:42” |
If treated as a string, we can only perform operations such as:
This severely limits analysis.
Format conversions help transform raw data into representations suitable for EDA and analytical models:
| Representation | Example | Possible analysis |
|---|---|---|
| Numeric timestamp | 1741789385 | time differences, time series |
| Hour of day | 14 | activity patterns during the day |
| Day of week | Wednesday | weekday vs. weekend behavior |
| Day of year | 71 | seasonal patterns |
Please take 1–2 minutes to reflect on today's session.