Frankfurt School Logo

Machine Learning for Big Data

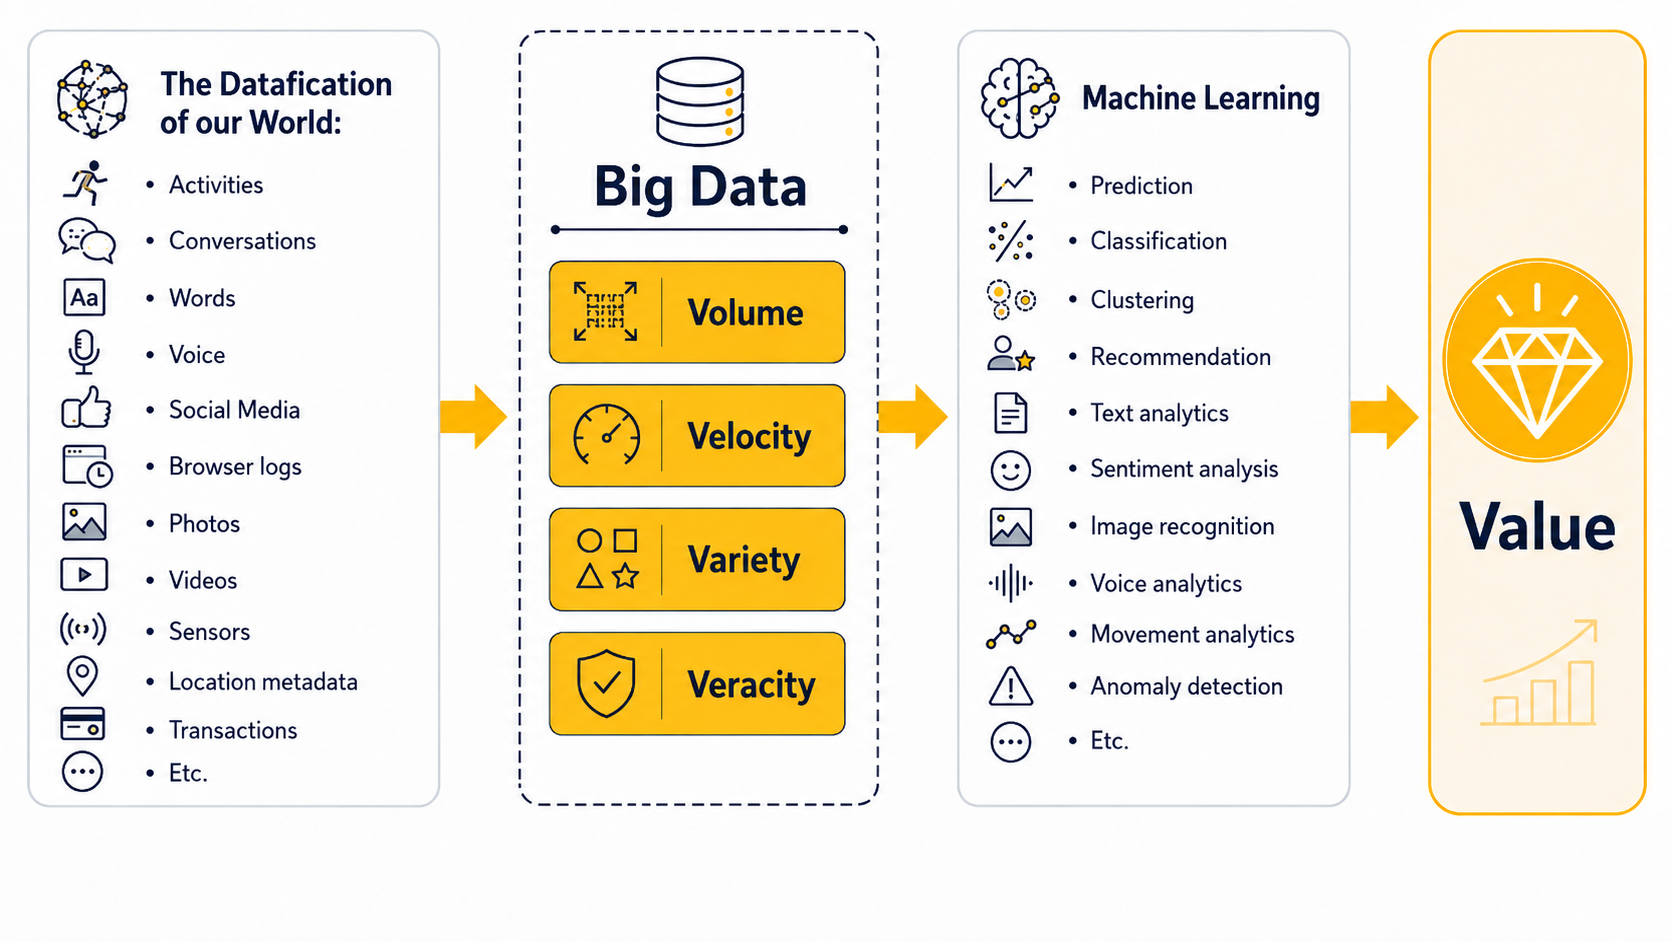
Big Data

Session 1 | 2026-09-04


  • Describe the growth and principal sources of large-scale data.
  • Explain the four characteristics of big data and their business implications.
  • Use RStudio and Quarto to import, inspect, and analyze data in a reproducible analytical workflow.

The growth of data

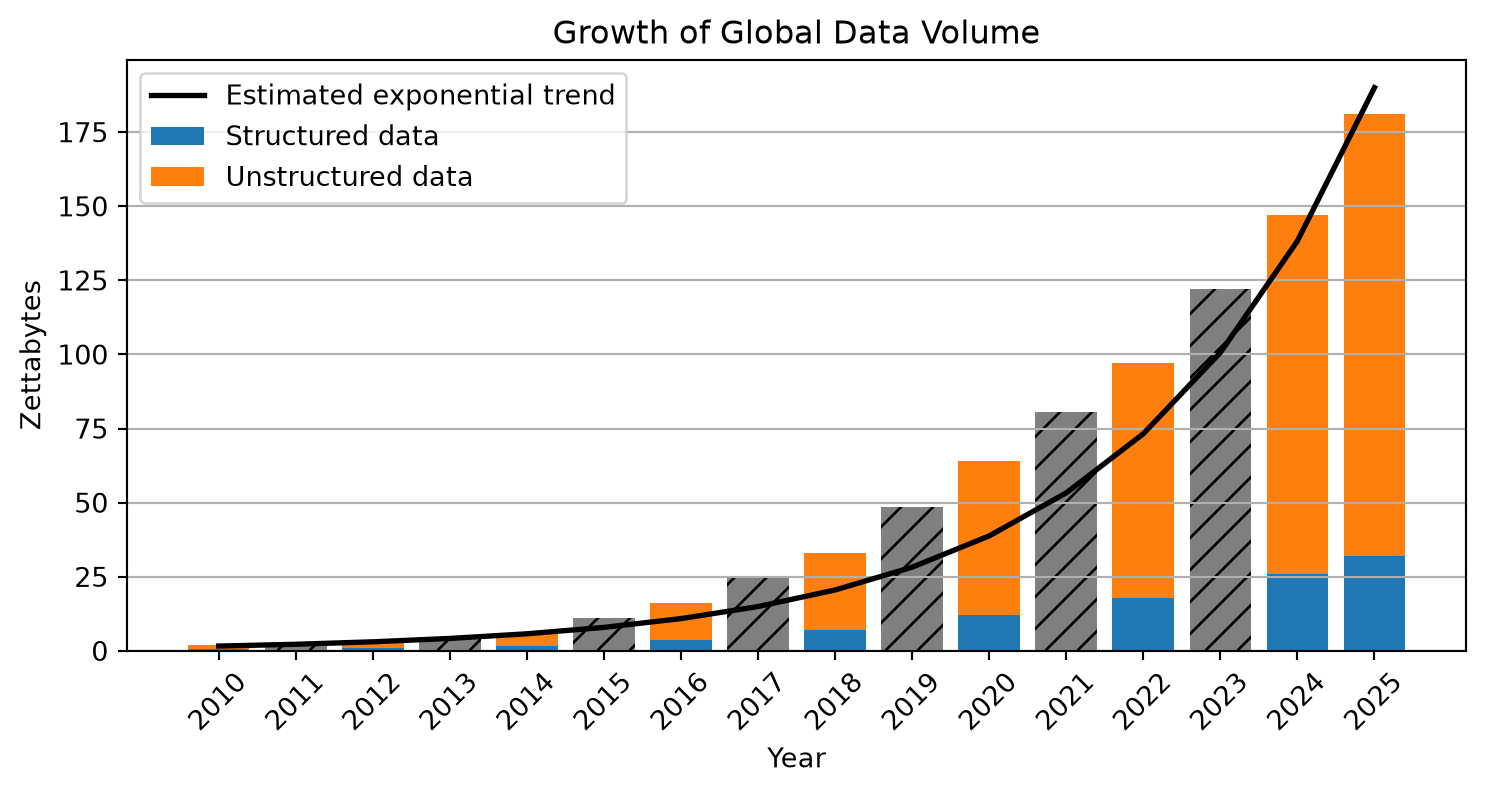
The exponential growth of data


Unit Equivalent Approximate meaning
Gigabyte (GB) A HD movie file or a few hundred photos
Terabyte (TB) 1,000 GB Storage of a modern laptop or external drive
Petabyte (PB) 1,000 TB Data of a large company or several large data centers
Exabyte (EB) 1,000 PB Roughly the yearly internet traffic of a small country
Zettabyte (ZB) 1,000 EB \(\approx 1\) trillion gigabytes; global data creation scale


Data production

Enterprise and transactional data
Enterprise systems such as ERP, CRM, and supply chain platforms generate large volumes of structured data through everyday business transactions.

E-commerce
Every search, click, purchase, and review creates behavioral and transactional data used for recommendations and personalized marketing.

Social media and user-generated content
Platforms such as TikTok, YouTube, and Instagram generate enormous data volumes through uploads, interactions, and live-streaming.

IoT and smart devices
Connected devices—from wearables to industrial sensors—continuously produce real-time data across interconnected systems.

AI-generated data
Machine learning and generative AI create large datasets during training and operation, further accelerating global data growth.

Defining big data

The 4 V’s of big data

Big data matters when the properties of the data change what managers can decide, automate, or compete on.
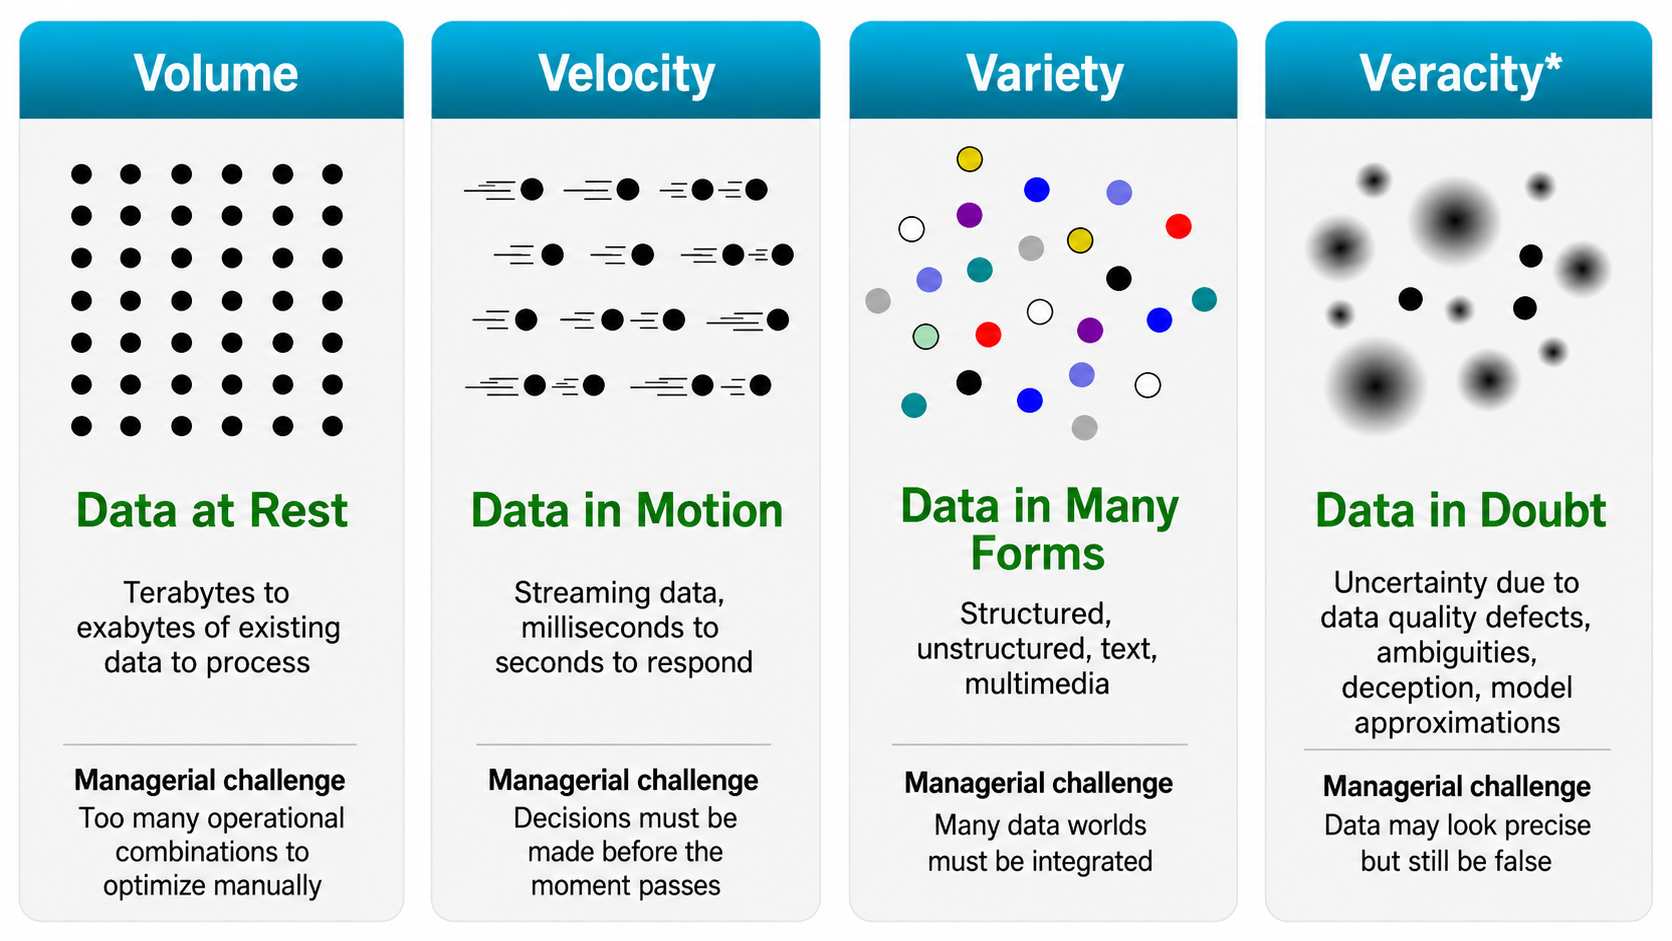
Examples of big data in different industries

Volume: UPS route optimization

Analytical question

How do you optimize millions of delivery decisions when every route has thousands of possible variants?

Key data facts

  • 250M+ address data points
  • 200,000+ route options per typical route
  • Parcels, drivers, fleet, road network, customer constraints
  • Real-time updates from operations and telematics

Models: vehicle routing · scheduling · ETA prediction · dynamic re-optimization
Outcomes: fewer miles · lower fuel costs · better on-time delivery · operational data advantage

UPS delivery truck or route optimization image

Velocity: Visa fraud detection

Analytical question

Can fraud be detected before the transaction is approved?

Key data facts

  • Up to 83,000 transactions / second
  • \(\approx\) 7.17B decisions / day at peak capacity
  • 500+ data points per transaction
  • Fraud is rare, but losses are massive
  • Visa reported $40B+ fraud blocked in 2023

Models: real-time risk scoring · anomaly detection · streaming ML · network analysis
Outcomes: approve · decline · challenge · escalate — all within milliseconds

Digital payment or fraud detection image

Variety: Walmart ambient IoT supply chain

Analytical question

How do you coordinate inventory when the relevant data comes from many different worlds?

Key data facts

  • Target: 90M pallets by end of 2026
  • Active in 500 Walmart locations
  • Potential scale: 4,600 stores + 40+ distribution centers
  • Sensor data: location, movement, temperature, humidity, dwell time
  • Combined with inventory, supplier, store, and replenishment data

Models: sensor fusion · demand forecasting · replenishment optimization · exception detection
Outcomes: fewer stockouts · fresher products · less waste · tighter supplier coordination

Retail supply chain or IoT pallet tracking image

Veracity: Digital advertising fraud

Analytical question

The dashboard says there were clicks and impressions — but were they real?

Key data facts

  • Fraudulent impressions, clicks, conversions, or data events
  • DoubleVerify measures 8.3T+ media transactions / year
  • Ad fraud losses projected at $172B by 2028
  • One fraud operation fell from 2.5B to 100M daily bid requests after mitigation

Models: bot detection · invalid traffic scoring · anomaly detection · graph analysis
Outcomes: block fake traffic · clean attribution · reallocate spend · protect ROI
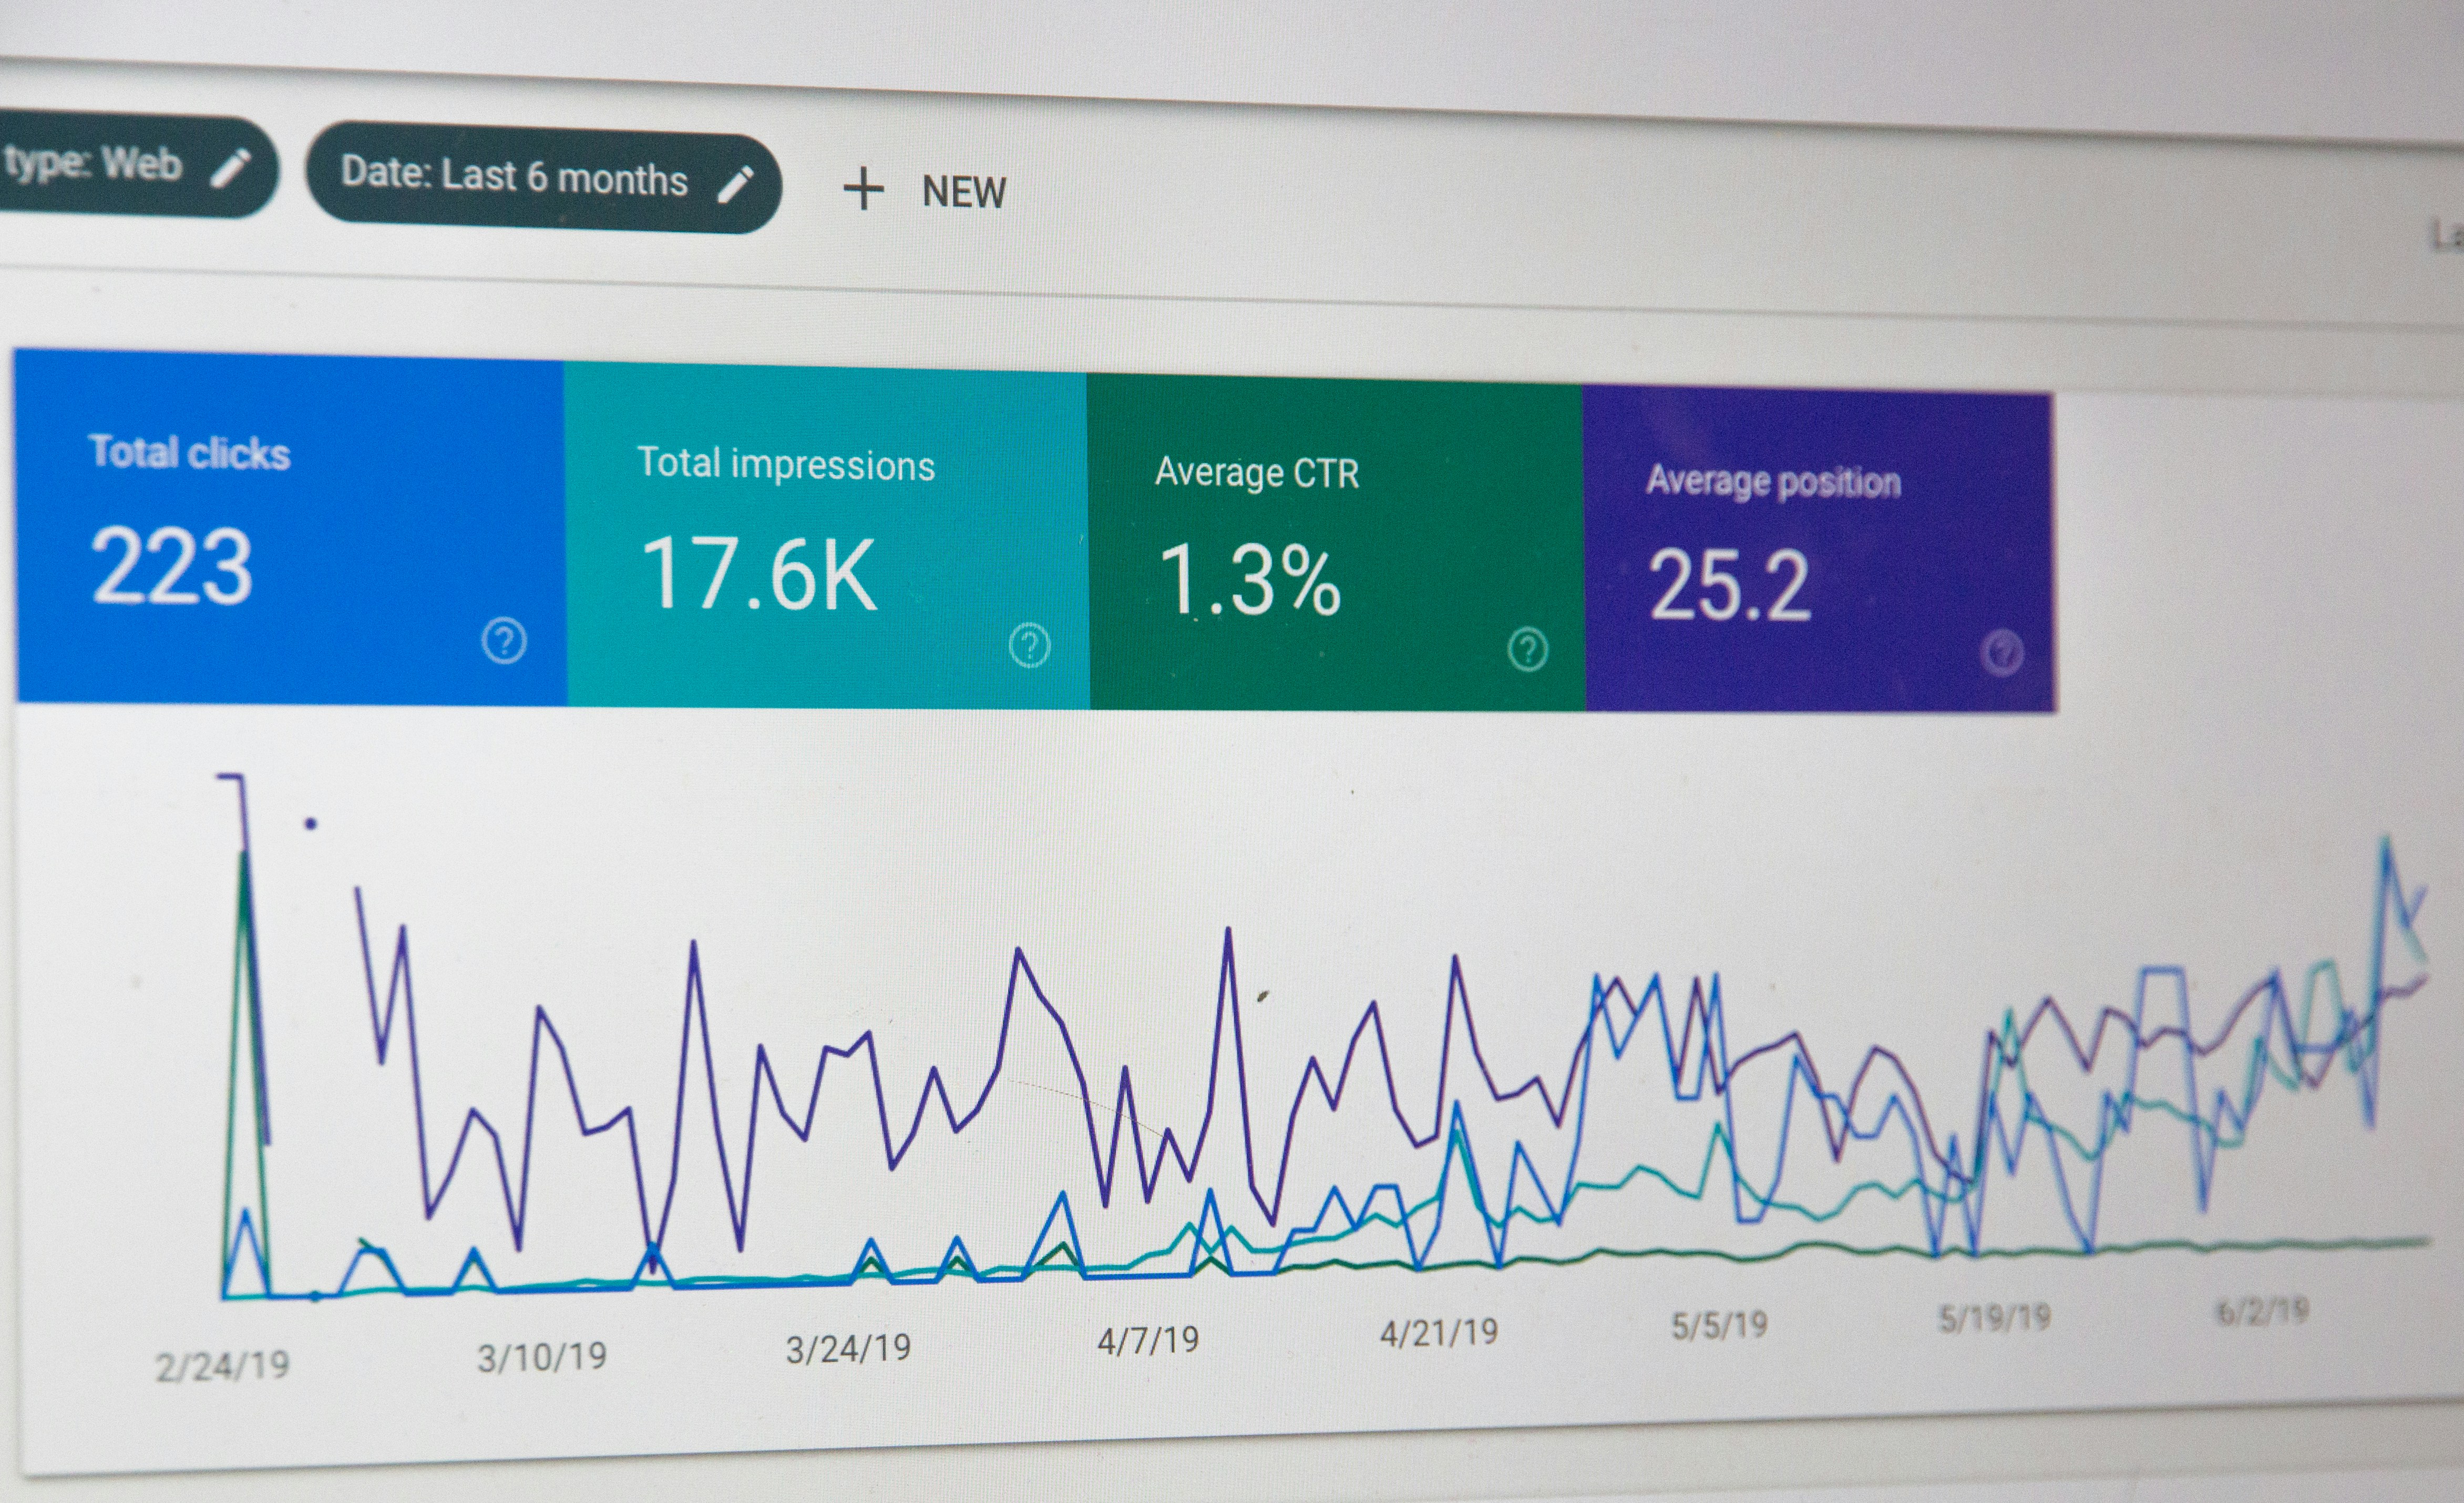
Digital advertising fraud or bot traffic image

Metadata: Location intelligence

Analytical question

How can organizations reconstruct where devices have been, when, and with whom they co-located from billions of metadata observations?

Key data facts

  • Persistent device or advertising identifier
  • Timestamp + latitude + longitude
  • Continuous streams create detailed movement histories
  • Billions of small observations can accumulate rapidly
  • Metadata can reveal routines and relationships without recording content

Models: spatio-temporal indexing · geofencing · trajectory analysis · clustering · network analysis
Outcomes: recommend location-specific products and services · personalize offers · optimize site selection · analyze mobility patterns · support real-time decisions

Map showing time-stamped device locations and movement trajectories

Defining big data

Critically analyzing examples of Big Data

Discuss with your neighbor (5 min)

Revisit the examples from the previous slides and add one or two examples of your own.

For each case, consider:

  • Which of the four V dimensions does it exhibit?
  • Which dimensions are particularly strong or weak?
  • Are there examples that clearly exhibit all four Vs?
  • Do Big Data need to satisfy all four Vs?

Be prepared to share one interesting or ambiguous case.

Are all Vs necessary for Big Data?

Kitchin and McArdle (2016) examined 26 datasets commonly described as Big Data across seven domains.

Their findings challenge a simple V-based checklist:

  • Only a handful of datasets exhibited all characteristics they examined.
  • Even volume and variety were not necessary: some accepted Big Data datasets were neither exceptionally large nor diverse.
  • The clearest distinction was velocity and exhaustivity: Big Data tend to capture continuous or rapidly generated data across an entire system, rather than slower, sampled observations.

Key takeaway

Big Data is not simply “very large data.”

It is better understood as a combination of characteristics rather than as data that must satisfy every V.

Summary

  • Data volumes and sources have expanded rapidly, creating new analytical opportunities.
  • Volume, velocity, variety, and veracity create distinct analytical and managerial challenges.
  • Big-data applications combine different forms of data and machine learning models to create business value.

Analytical setup

Setup for the practical exercises

Options

  • Microsoft Excel
  • Microsoft Power BI
  • IBM SPSS Statistics
  • RapidMiner
  • Tableau
  • Python
  • R + RStudio + Quarto

Why this setup?

We use R, RStudio, and Quarto because

  • they support advanced analytics, including data preparation, visualization, statistical modeling, and machine learning
  • working with code provides a transparent and reproducible analytical workflow
  • R is widely used in analytics and research
  • Quarto combines context, code, explanations, results, and implications in a single document
  • the skills transfer well to other analytical tools and programming environments

The analytical environment

R

Executes the analytical code.

RStudio

Provides the development environment for

  • writing and running R code
  • inspecting data and objects
  • managing files and projects
  • working with Quarto documents

Quarto

Combines text, code, results, tables, and visualizations into a reproducible analytical document.
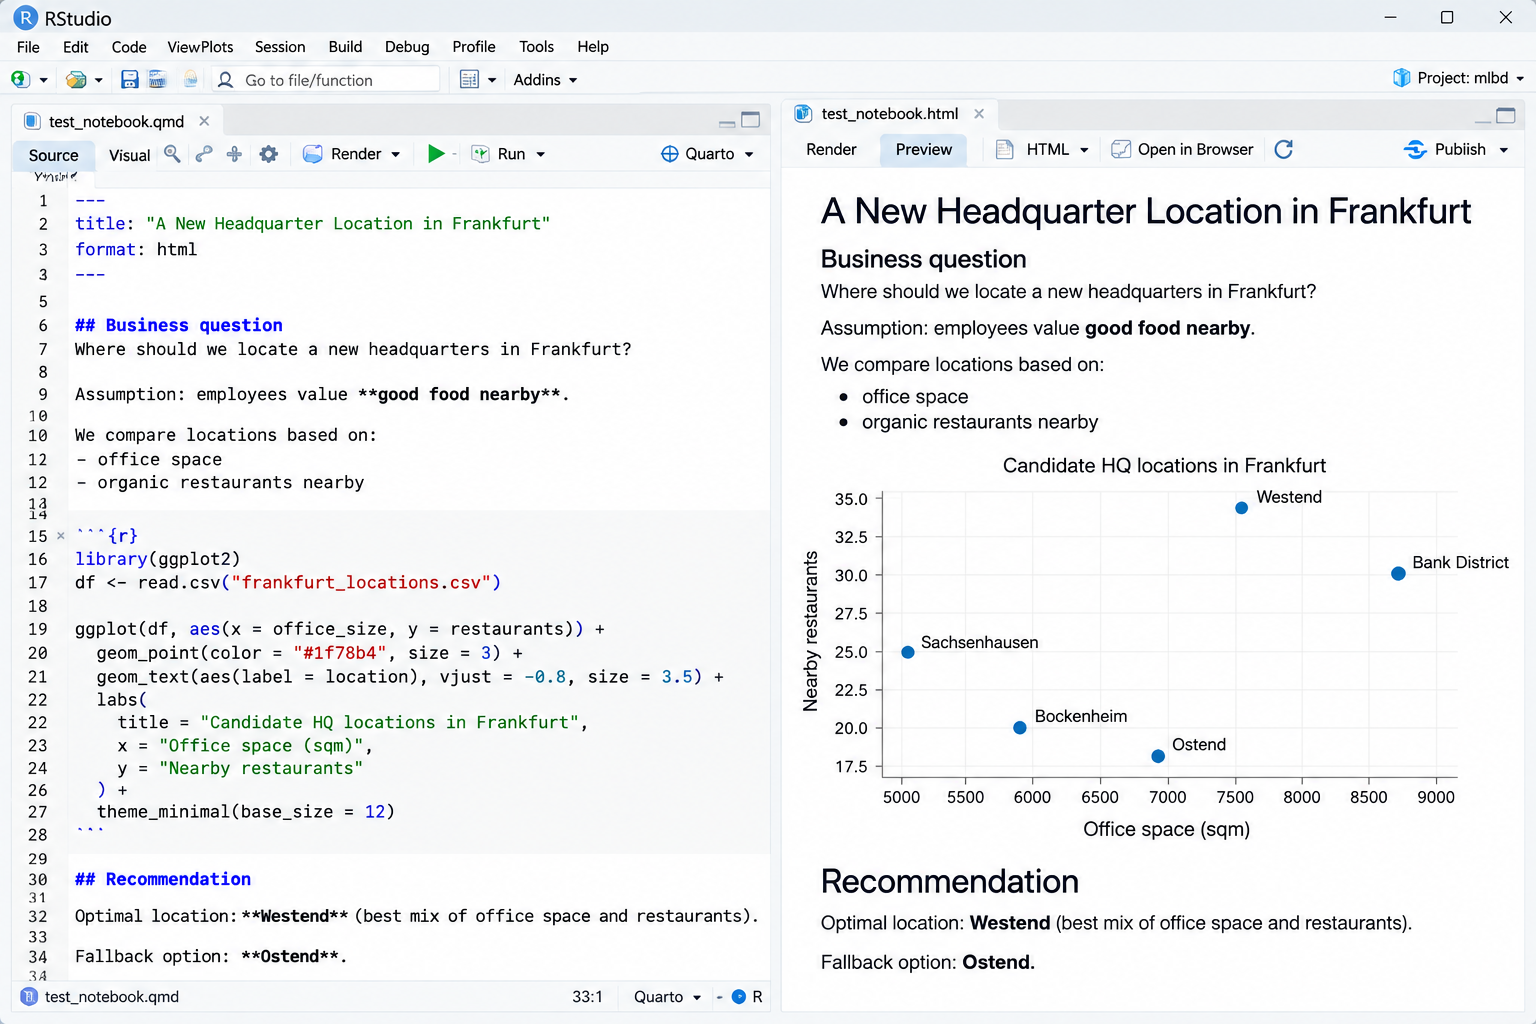
In this course, the Quarto document is the central analytical artifact.

Local setup

Please install RStudio Desktop on your computer.

Then verify your setup:

  1. Open RStudio.
  2. Create a new Quarto document.
  3. Select R as the computation engine.
  4. Add and execute an R code chunk.
  5. Render the document.

If the code executes and the document renders successfully, your analytical environment is ready.

Practical exercise: A first Quarto report

Base task

  • Create a Quarto document called report.qmd.
  • Select a suitable dataset from Kaggle and download it as CSV.
  • Create an R codeblock to import the CSV and display the first rows using head().
  • Add a short analytical question that could be investigated using the dataset.
  • Render the document as HTML.

Optional extensions

Consult the documentation of Quarto or the Tidyverse and implement additional feature(s) of your choice:

  • Create a scatterplot with ggplot2 and hide the code in the rendered document.
  • Add a citation and a bibliography.
  • Render the document as PDF.


Take-home exercise: Develop a potential group project topic

Use your document as a starting point for a potential group project topic.

  • Formulate a business or analytical question.
  • Describe the business context and why the question is relevant.
  • Identify the data and variables that would be needed.
  • Describe suitable analytical methods.
  • Explain which business decisions the analysis could support.

Summary

In the practical part, we learned how to:

  • create and structure a Quarto (.qmd) document,
  • import and inspect data with R,
  • combine text, code, and analytical output in one document,
  • and render the analysis as HTML or PDF.


Preparation

Before the break, please install the tidyverse package for the exercises:

install.packages("tidyverse")

Feedback

Please take 1–2 minutes to reflect on today's session.

Complete the short feedback survey

References

Kitchin, Rob, and Gavin McArdle. 2016. “What Makes Big Data, Big Data? Exploring the Ontological Characteristics of 26 Datasets.” Big Data & Society 3 (1). https://doi.org/10.1177/2053951716631130.
Wickham, Hadley, Mara Averick, Jennifer Bryan, et al. 2019. “Welcome to the Tidyverse.” Journal of Open Source Software 4 (43): 1686. https://doi.org/10.21105/joss.01686.