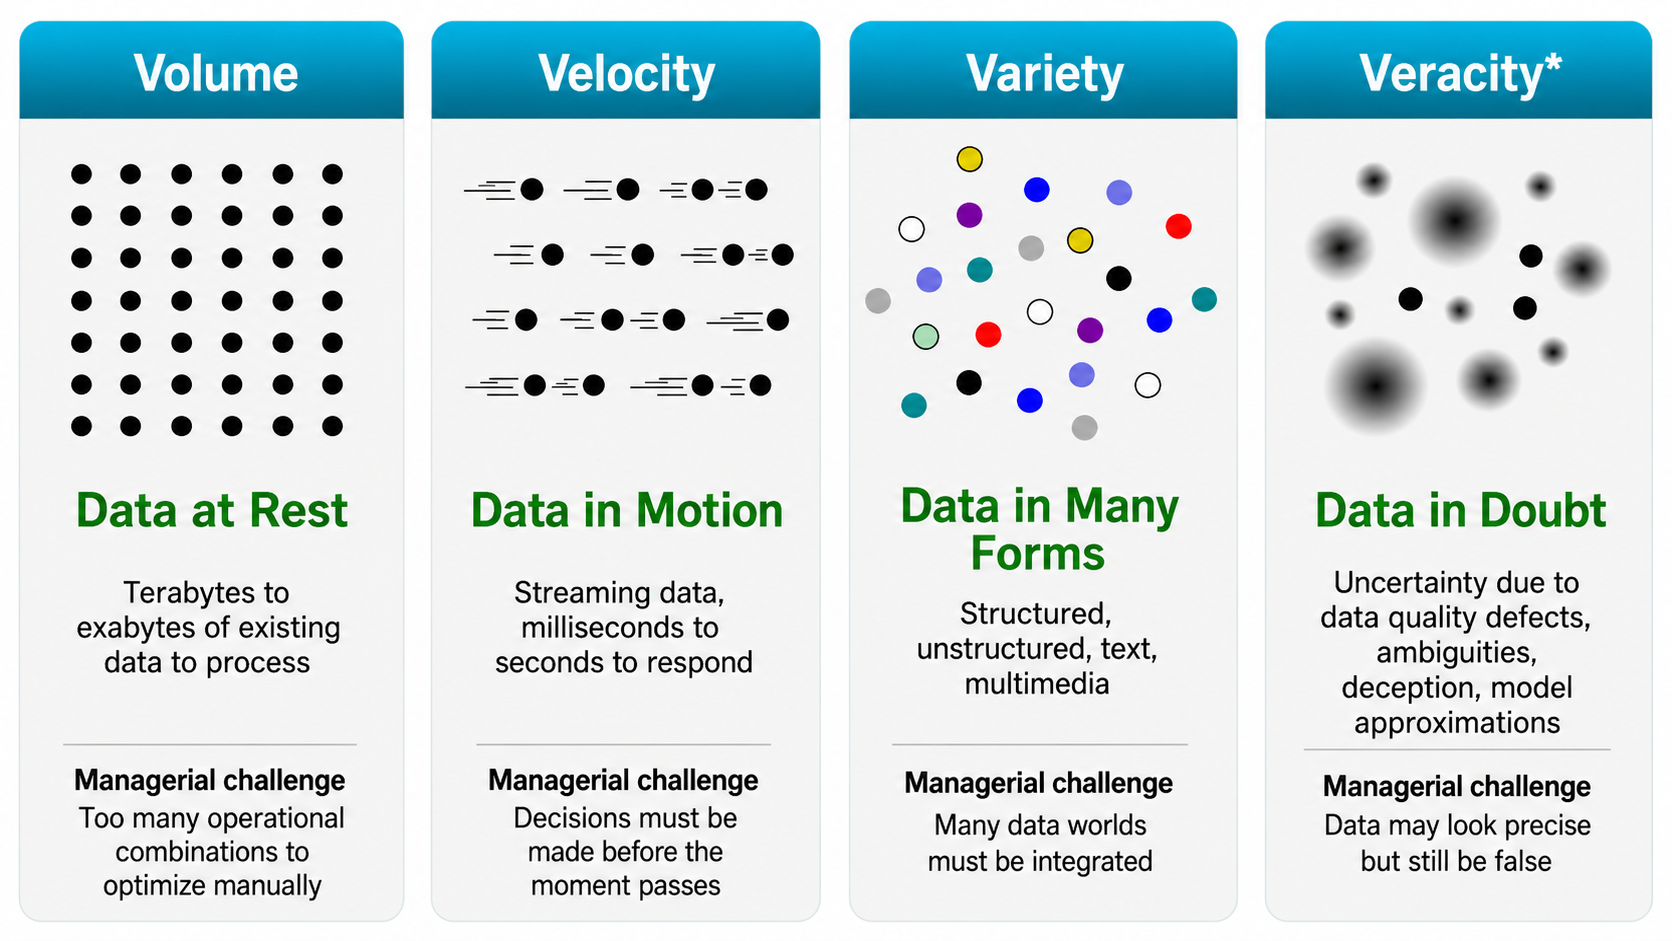
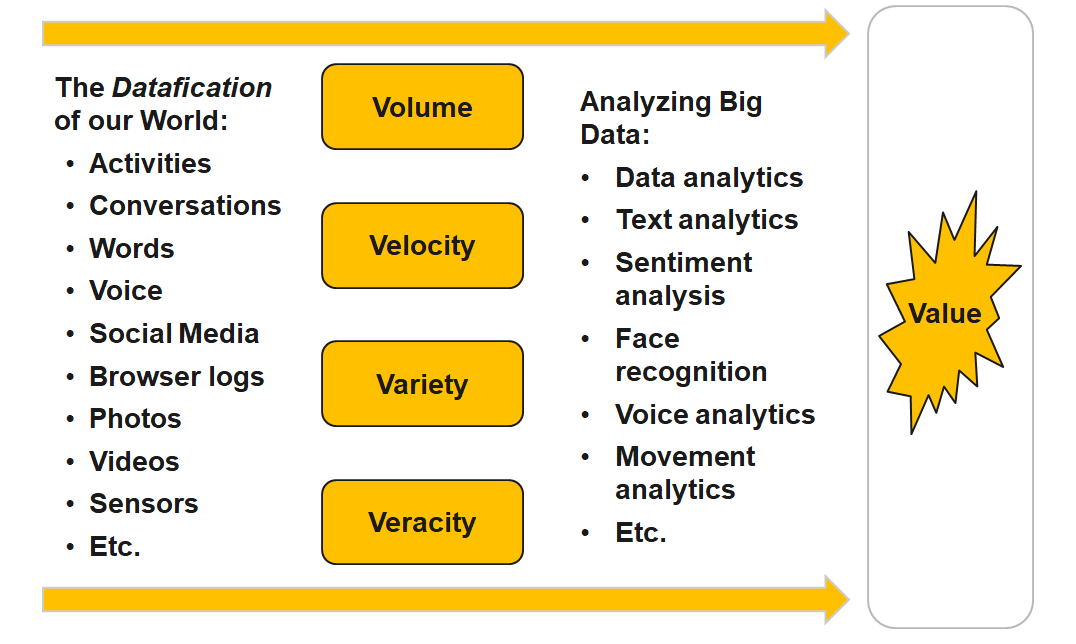
Frankfurt School Logo

Analytics & Big Data

Session 8: Big data 1

Prof. Dr. Gerit Wagner

(2026-05-04)


  • Explain the characteristics of big data and their implications for analytics workflows.
  • Compare data warehouse, data lake, and logical data warehouse architectures.
  • Describe the text analytics pipeline from preprocessing to representation and modeling.

Big data

4V’s of big data

Big data matters when the properties of the data change what managers can decide, automate, or compete on.

Volume: UPS route optimization

Managerial dilemma

How do you optimize millions of delivery decisions when every route has thousands of possible variants?

Key data facts

  • 250M+ address data points
  • 200,000+ route options per typical route
  • Parcels, drivers, fleet, road network, customer constraints
  • Real-time updates from operations and telematics

Models: vehicle routing · scheduling · ETA prediction · dynamic re-optimization
Outcomes: fewer miles · lower fuel costs · better on-time delivery · operational data advantage

UPS delivery truck or route optimization image

Velocity: Visa fraud detection

Managerial dilemma

Can fraud be detected before the transaction is approved?

Key data facts

  • Up to 83,000 transactions / second
  • 7.17B decisions / day at peak capacity
  • 500+ data points per transaction
  • Fraud is rare, but losses are massive
  • Visa reported $40B+ fraud blocked in 2023

Models: real-time risk scoring · anomaly detection · streaming ML · network analysis
Outcomes: approve · decline · challenge · escalate — all within milliseconds

Digital payment or fraud detection image

Variety: Walmart ambient IoT supply chain

Managerial dilemma

How do you coordinate inventory when the relevant data comes from many different worlds?

Key data facts

  • Target: 90M pallets by end of 2026
  • Active in 500 Walmart locations
  • Potential scale: 4,600 stores + 40+ distribution centers
  • Sensor data: location, movement, temperature, humidity, dwell time
  • Combined with inventory, supplier, store, and replenishment data

Models: sensor fusion · demand forecasting · replenishment optimization · exception detection
Outcomes: fewer stockouts · fresher products · less waste · tighter supplier coordination

Retail supply chain or IoT pallet tracking image

Veracity: Digital advertising fraud

Managerial dilemma

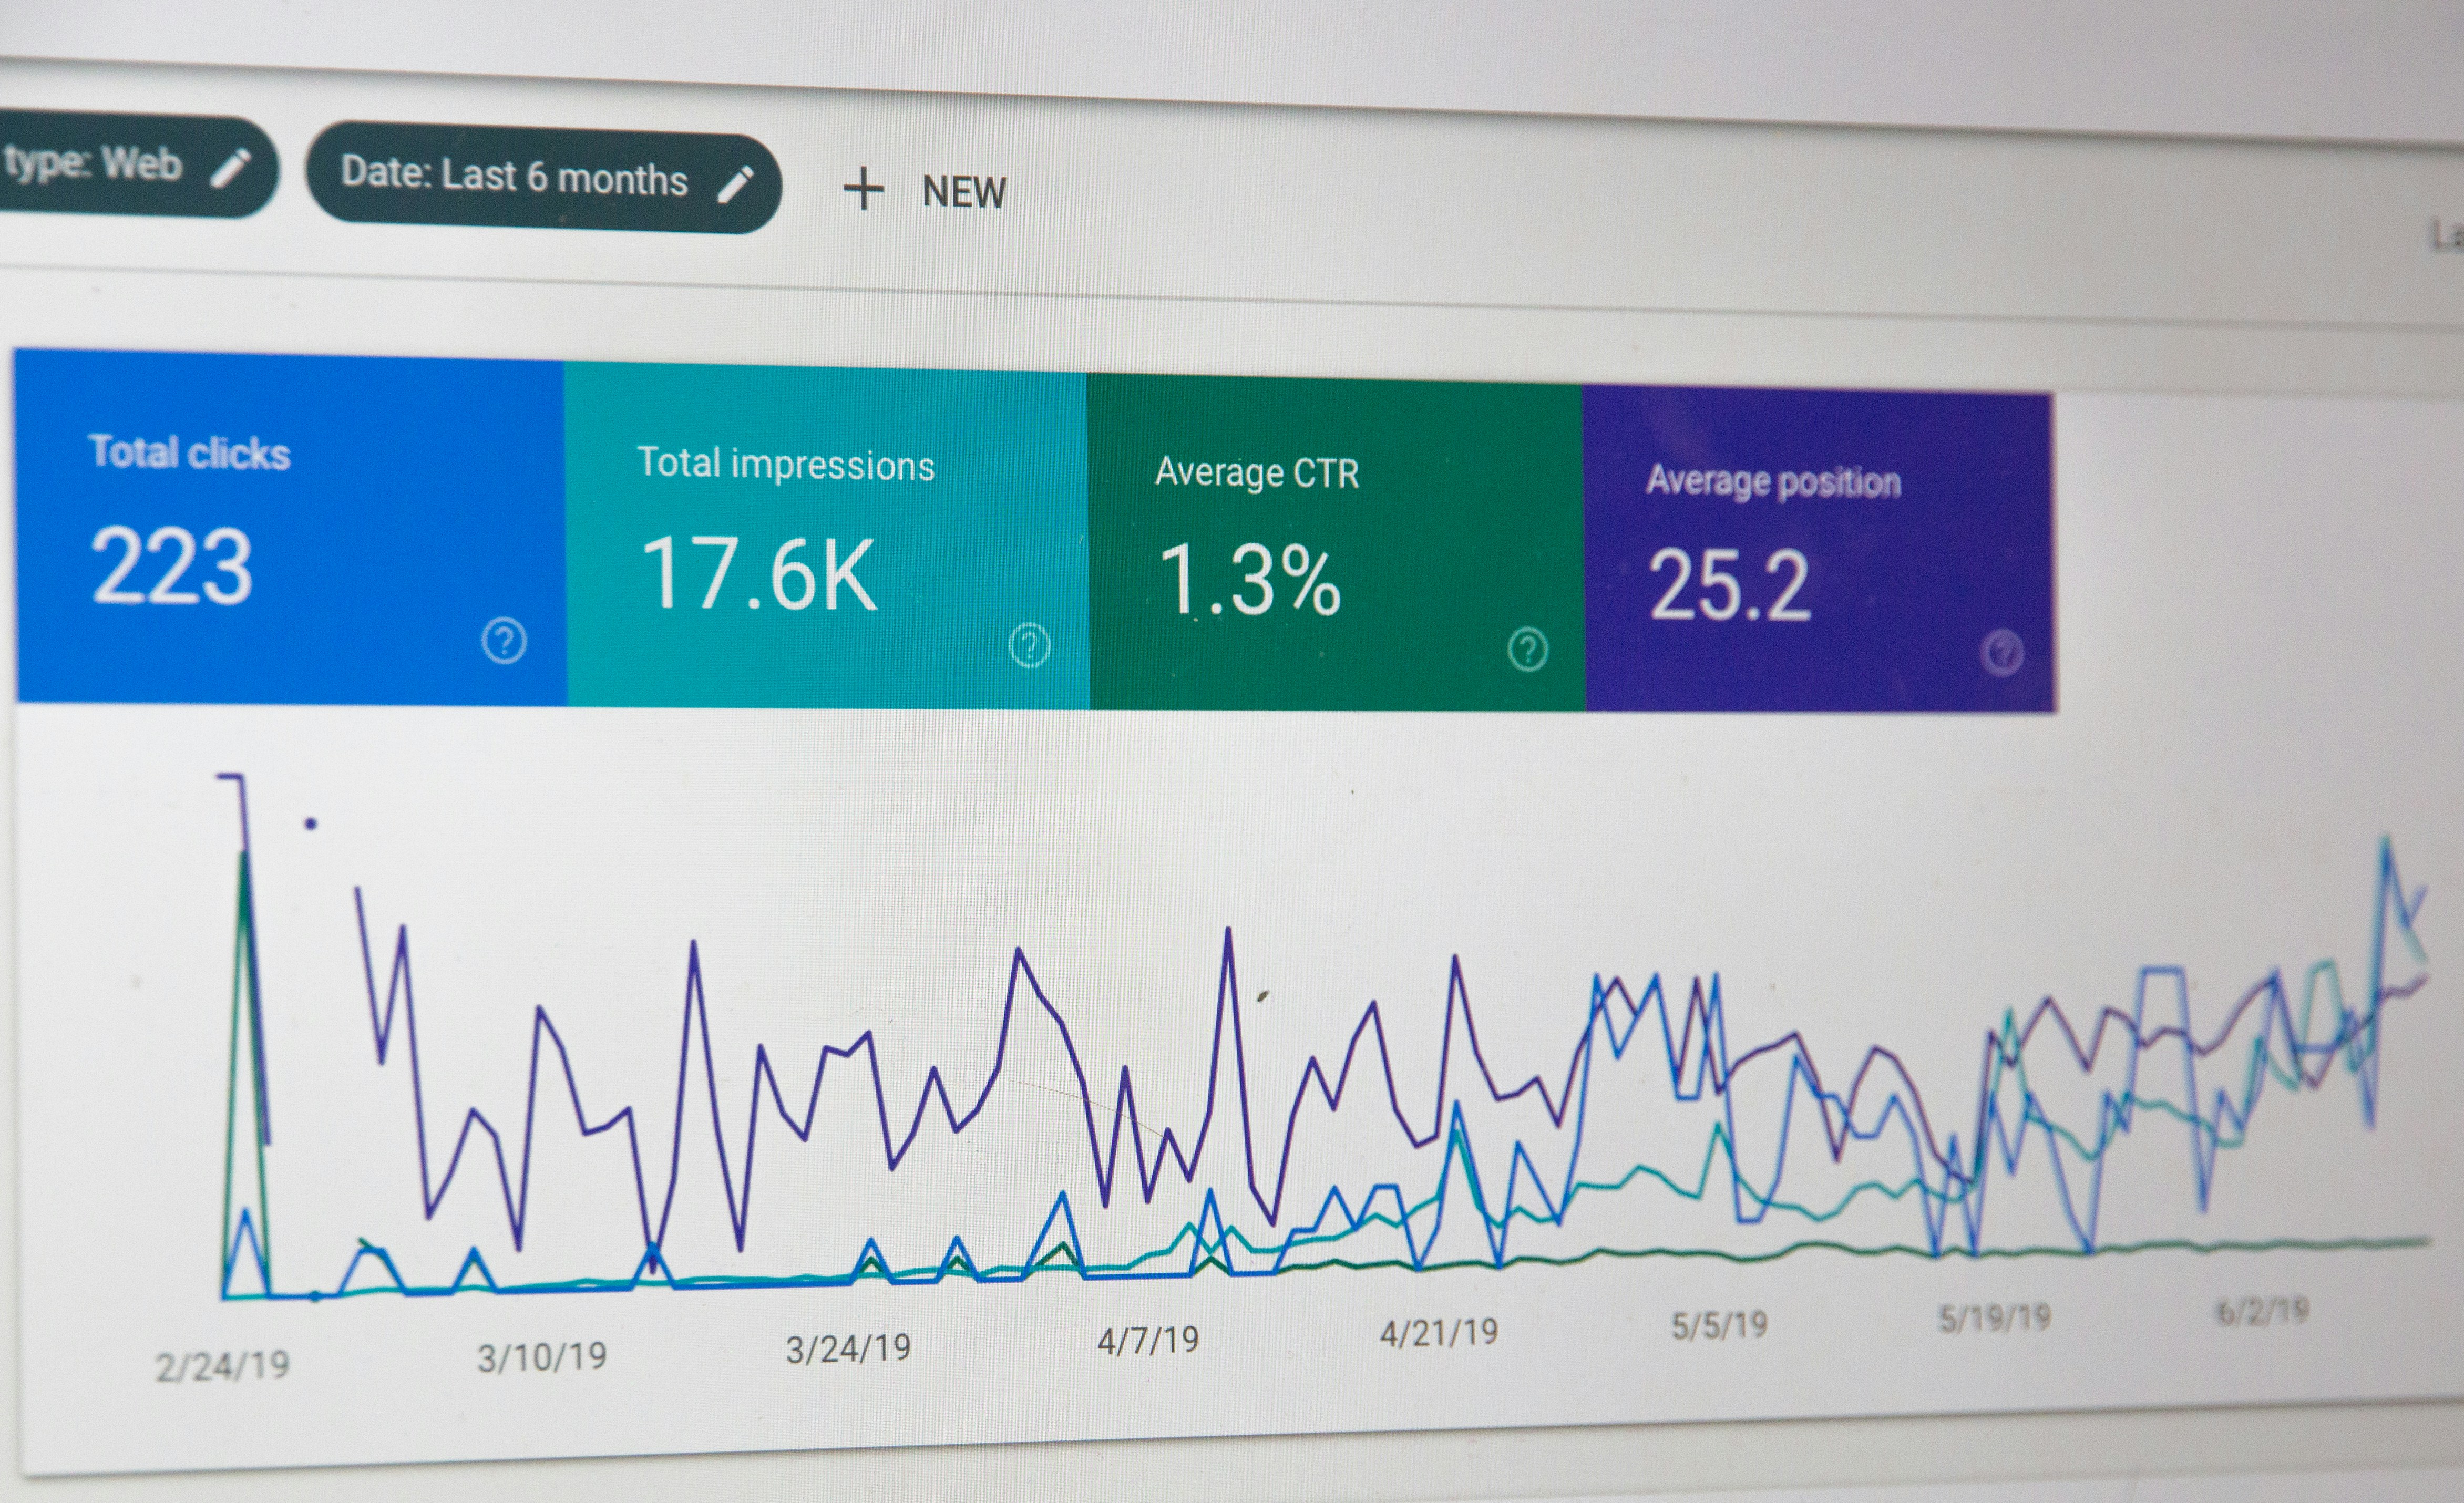
The dashboard says there were clicks and impressions — but were they real?

Key data facts

  • Fraudulent impressions, clicks, conversions, or data events
  • DoubleVerify measures 8.3T+ media transactions / year
  • Ad fraud losses projected at $172B by 2028
  • One fraud operation fell from 2.5B to 100M daily bid requests after mitigation

Models: bot detection · invalid traffic scoring · anomaly detection · graph analysis
Outcomes: block fake traffic · clean attribution · reallocate spend · protect ROI
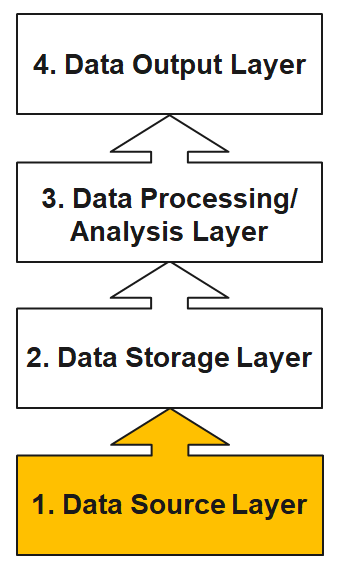
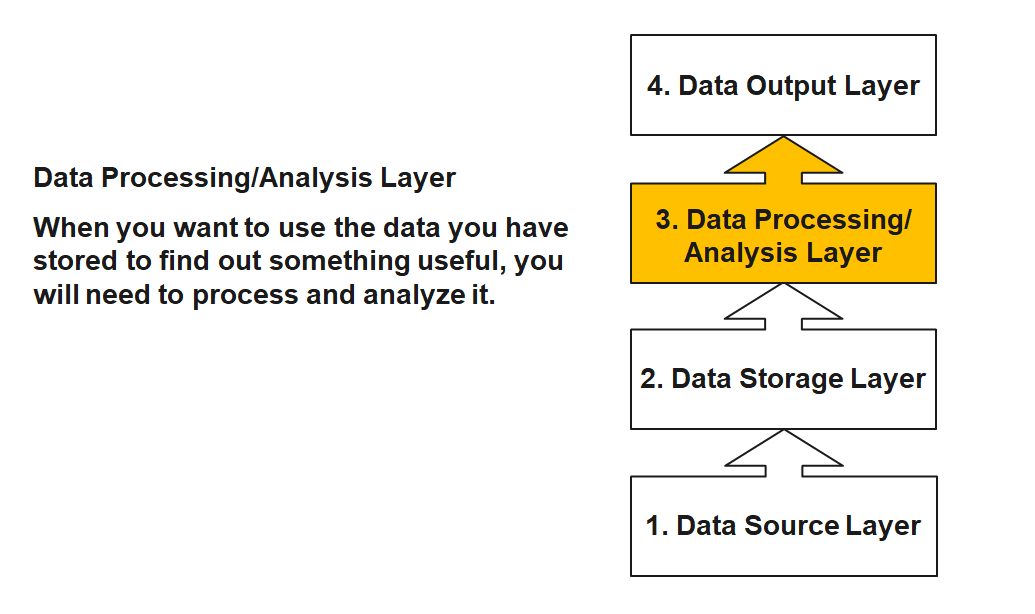
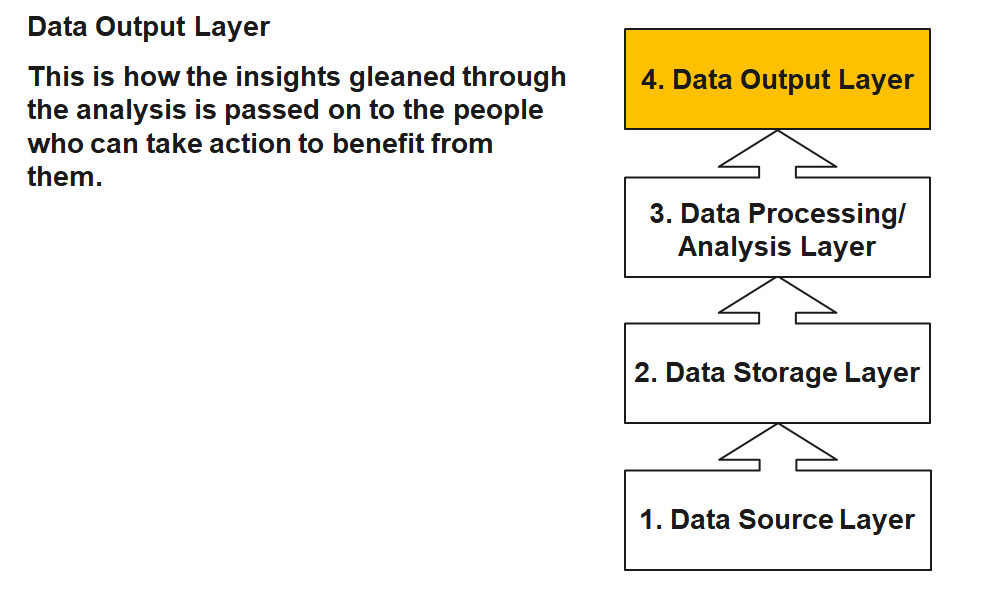
Digital advertising fraud or bot traffic image

Turning big data into value


Architecture

Limitations of the data warehouse approach

Traditional DWH solutions are designed to provide a single point of truth. Important aspects are:

  • Merge and unify data from multiple data sources
  • High data quality
  • Proper historization of the data
  • Data Governance and Compliance

This results in the following problem areas in today’s world:

  • Lack of flexibility due to high effort for changes
  • Time expenditure due to transfer from the operational sources and the aggregations
  • Past orientation of data (snapshot of the past); there is an increasing need for ad hoc and real-time analyses
  • Partial knowledge, as only structured data is stored, with increasing need for social media data, etc.
  • Patchwork: due to gradual introduction of data warehouses, many isolated solutions exist and are operated separately both technically and methodologically

The four layers of big data (I)

Data Source Layer

This is where the data arrives at the organization. It includes everything from sales records, customer database, feedback, social media channels, marketing list, email archives etc.

Identify and prioritize data sources

The four layers of big data (II)

The four layers of big data (III)

The four layers of big data (IV)

From data warehouse to data lake

Instead of recording millions of transactions, today’s organizations are recording billions of interactions. Companies are capturing more and more data that can open business opportunities and unlock new sources of value for organizations.

Companies are not able to store this data in data warehouses because it is of high volume, mostly raw and often not structured. As consequence, data lakes have emerged as an alternative approach. The intent is to capture enterprise data and load it in its raw form into a centralized, large, and inexpensive storage system.

In shifting from data warehouses to data lakes, it became important to decouple data movement from data transformation. Data movement (the “E” and “L” of ETL) is an operational task. Data transformation (the “T” of ETL) is a content-based, analytic-facing task that requires an understanding both of the data and how it’s to be used.

A clean separation between data movement and data transformation has the benefits of less friction because the instance loading the data isn’t responsible for transforming it.

The data lake

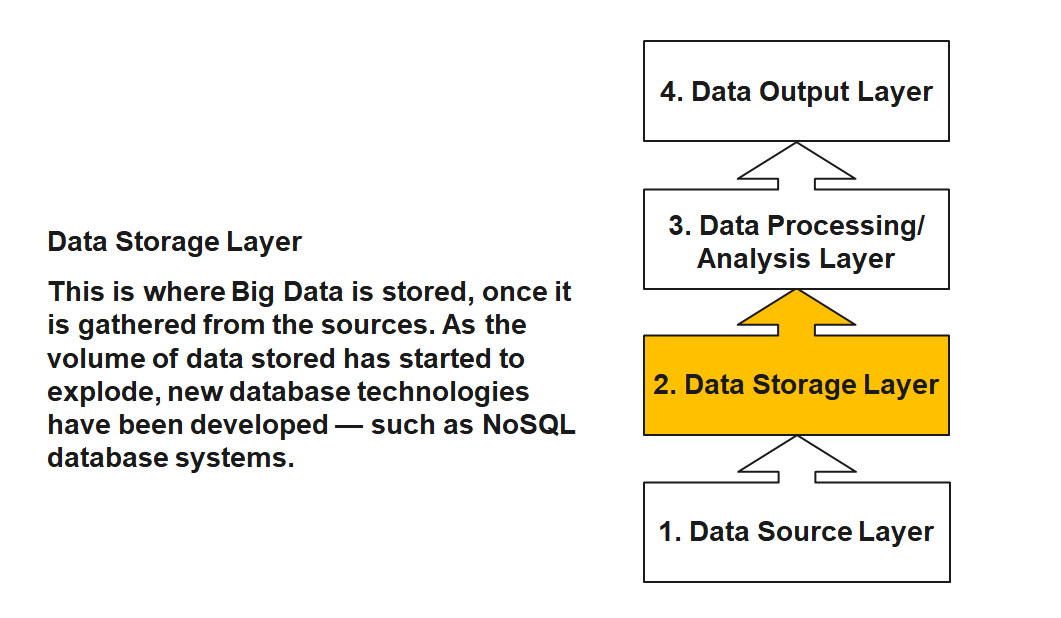
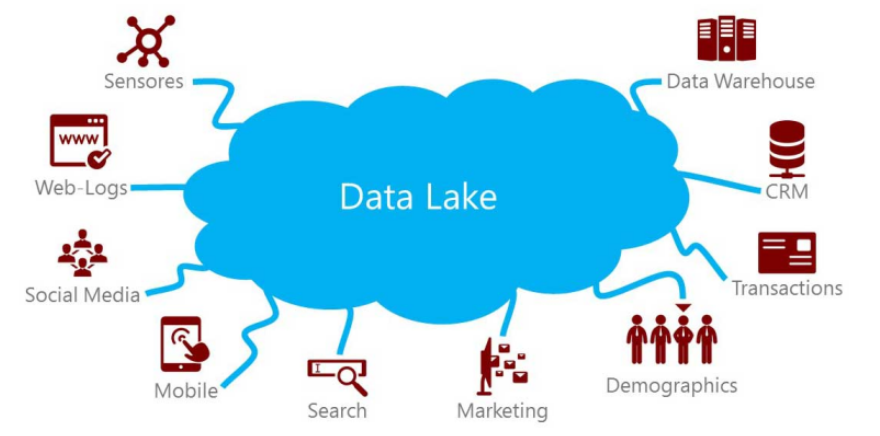
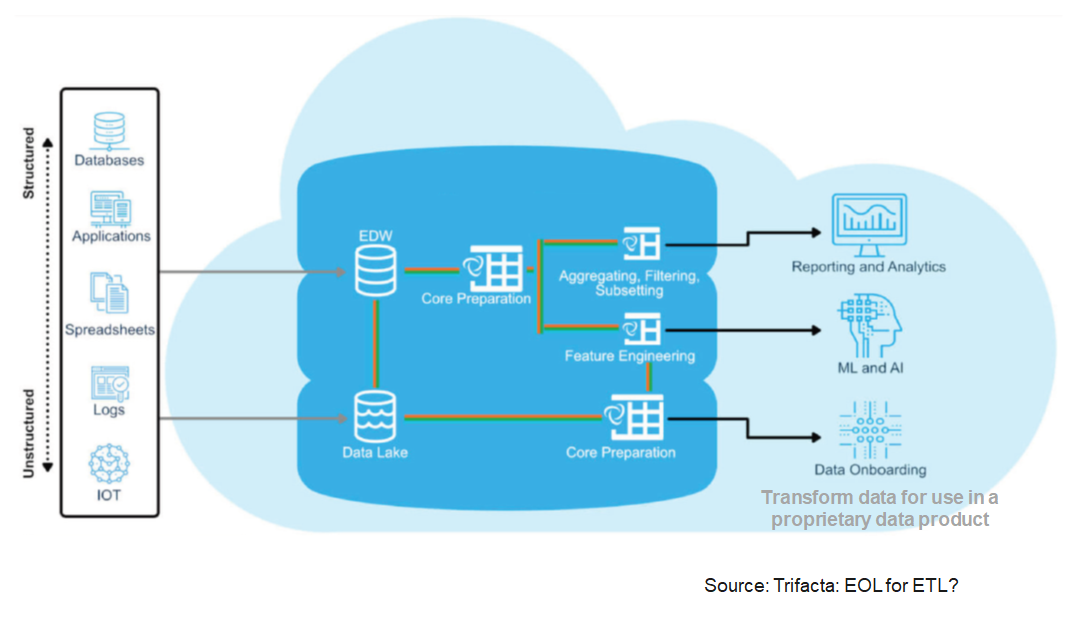
A data lake is a method of storing data within a system in its natural format, that facilitates the collocation of data in various schemata and structural forms. The idea of data lake is to have a single store of all data in the enterprise ranging from raw data to transformed data which is used for various tasks including reporting, visualization, analytics and machine learning.

Modern data analytics architecture

Logical data warehouse

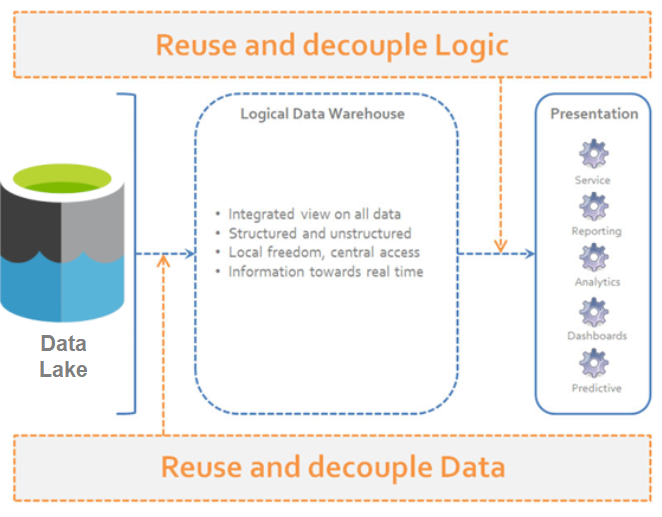
A “logical data warehouse” provides analytical company data without first physically moving it to a physical data warehouse.

As in a classic data warehouse, uniform views are provided for analysis purposes.

While the data in the classic data warehouse comes from a “well-defined” physically uniform database, the “logical data warehouse” pulls data together from the data lake at the time of the query.

Aggregation is done just in time. Thus, the schema of the data warehouse is just virtual.

Text analytics

Text analytics

The vast majority of global data is stored in unstructured formats. For example:

  • emails and internal communication
  • customer support tickets
  • meeting notes and reports
  • product reviews and social media posts
  • annual reports and corporate filings
  • contracts and legal documents
  • job descriptions and résumés
  • scientific and market research reports
  • CRM notes and sales reports
  • helpdesk and incident reports

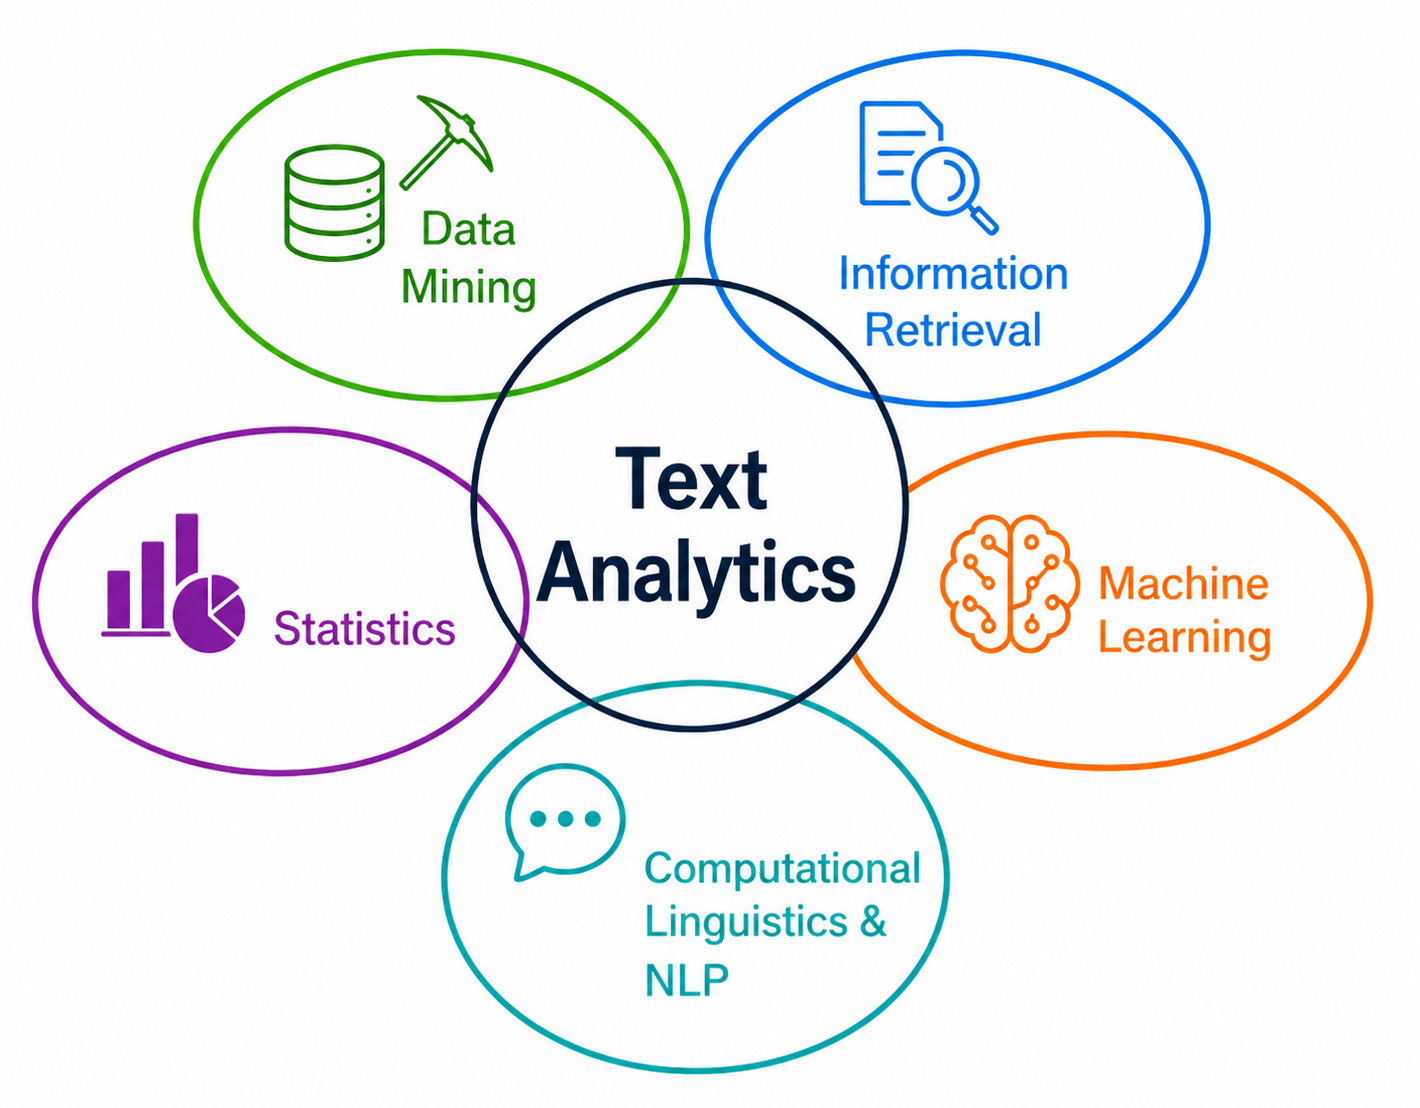
Text analytics combines methods from natural language processing, machine learning, information retrieval, and statistics to systematically analyze large volumes of textual data and derive actionable insights.

Application areas

Text preprocessing

Typical sources of noise

  • punctuation, HTML tags, URLs, emojis
  • inconsistent casing and formatting
  • very frequent but low-information words (stopwords)
  • morphological variants (user, users, using)

Preprocessing options (choose what fits the analytical approach)

  1. Text cleanup
    remove punctuation / HTML / special characters
  2. Tokenization
    split text into words or n-grams
  3. Stopword removal
    remove frequent low-information words
  4. Stemming / lemmatization
    reduce related word forms to a common base
  5. Advanced linguistic processing
    POS tagging, parsing, word sense disambiguation, synonym / pronoun normalization

Text processing: Examples

Stopword removal:

from sklearn.feature_extraction.text import CountVectorizer

documents = ["Jupiter is the largest gas planet."]

vectorizer = CountVectorizer(stop_words="english")
matrix = vectorizer.fit_transform(documents)
print(vectorizer.get_feature_names_out())
['gas' 'jupiter' 'largest' 'planet']

Feature generation: Sparse representations (classical NLP)

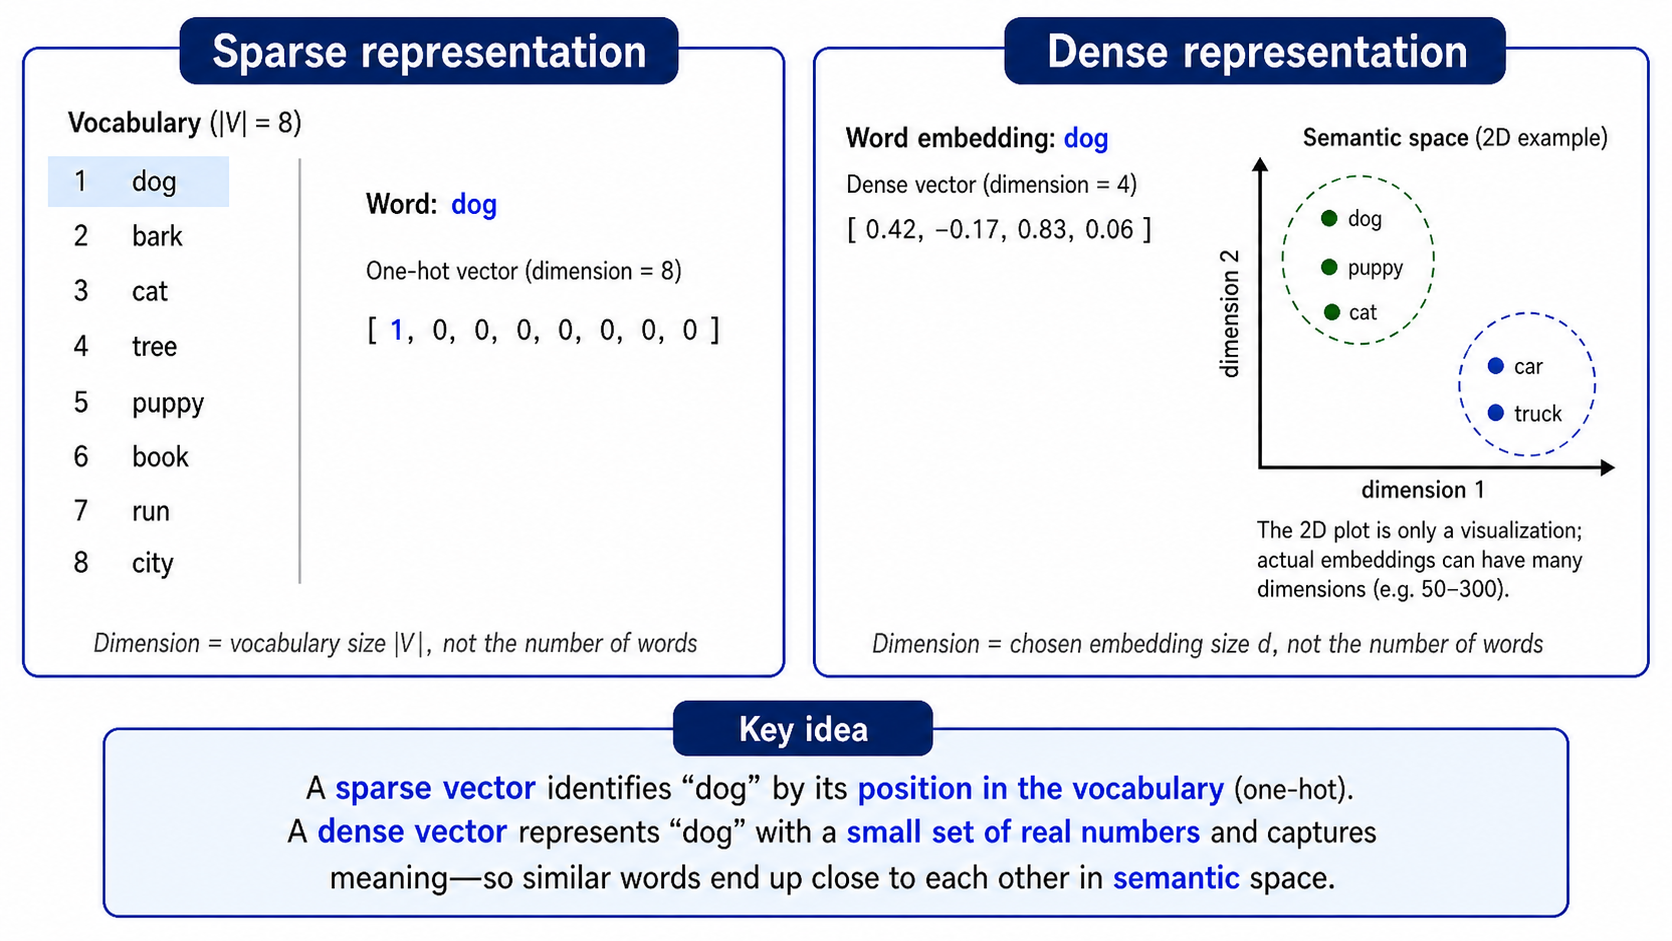
A document is treated as a bag of words or terms.

  • each word or term becomes a feature
  • word order is ignored
  • each document is represented as a vector
  • the result is a structured document-term matrix

Key idea: Text is transformed into numerical features that can be used by classical machine learning models.


Ways to create vectors

Technique Feature value
Binary term occurrence term appears: yes / no
Term occurrence number of times a term appears
Term frequency occurrences divided by document length
TF-IDF frequency weighted by how distinctive the term is

Feature generation: TF-IDF example

TF-IDF (term frequency-inverse document frequency) measures how important a term is to a document relative to a corpus

  • \(tf\) (term frequency): how often a term appears in a document
  • \(idf\) (inverse document frequency): how rare a term is across the corpus

\[idf_i = log(\frac{N}{df_i})\]

with \(N\): total number of documents
\(df_i\): the number of documents in which \(t_i\) appears.

TF-IDF weight:

\[w_{ij} = tf_{ij} \times idf_i\]

  • Gives more weight to rare words
  • Gives less weight to common words (domain-specific stopwords)

Feature generation: Dense representations (embeddings)

  • Words are represented as dense vectors of real numbers, e.g., 50–300 values per word
  • Dense vectors capture semantic meaning, i.e., similar words get similar vector representations
  • Well-known methods: Word2Vec, GloVe, fastText, BERT

Feature generation: Dense representations (embeddings)

The sentence_transformers library offers pre-trained models for dense vectors:


from sentence_transformers import SentenceTransformer

model = SentenceTransformer("all-MiniLM-L6-v2")

text = "Customer reviews mention fast delivery and helpful support."

dense_vector = model.encode(text)

print(type(dense_vector))
print(dense_vector.shape)
print(dense_vector[:10])

<class ‘numpy.ndarray’>
(384,)
[-0.042 0.018 0.067 …]

Feature generation: Transformer-based analytics

Transformer models combine dense vectors with positional encoding:

Feature selection

In one-hot encoded documents, or in large corpora, feature selection can help to facilitate computation and avoid overfitting. Two major feature selection approaches in the context of text analytics are:

Pruning methods: removing words that are too infrequent or to frequent, based on absolute or percental thresholds.

Token filtering based on part-of-speech (POS): sometimes, the analyses focus on particular classes of words. For example:

  • For sentiment analysis, adjectives often carry evaluative meaning
    • good, bad, great
  • For clustering, nouns often define the topic or object
    • red cars and blue cars are about cars
    • red trousers and blue trousers are about trousers

Text analytics: Clustering

Typical goal: find groups of documents that are similar to each other

  • Start with a set of documents
  • Represent each document as a vector
    • sparse vectors: Bag-of-Words, TF-IDF
    • dense vectors: embeddings
  • Compare documents using a similarity measure
  • Use a clustering algorithm to group similar documents

Similarity measures for text data

Representation Typical similarity measure Useful for
Bag-of-Words / TF-IDF Cosine similarity comparing word-use patterns
Sets of words Jaccard similarity overlap between vocabularies
Dense embeddings Cosine similarity / Euclidean distance semantic similarity

Summary

  • Big data is not just “more data”; it changes analytics through volume, velocity, variety, and veracity. Each dimension creates a different managerial challenge: scaling decisions, acting in real time, integrating heterogeneous data, and deciding whether data can be trusted.

  • Big data architectures extend traditional data warehouses by separating data storage, data movement, and data transformation. Data warehouses emphasize structured, governed “single truth,” while data lakes store raw heterogeneous data; logical data warehouses provide virtual, query-time integration.

  • Text analytics turns unstructured text into analyzable data through a pipeline of preprocessing, feature generation, feature selection, and modeling. Classical approaches rely on sparse document-term matrices such as Bag-of-Words and TF-IDF.

  • Dense embeddings and Transformer-based models shift text analytics from manually engineered features toward semantic representations and integrated AI workflows. These representations support retrieval, similarity analysis, clustering, classification, summarization, information extraction, and RAG-based systems.

Survey: Session 8


https://forms.gle/hNuAD8UZvC8KYo4a8

References

Manning, C., & Schutze, H. (1999). Foundations of statistical natural language processing. MIT press. https://web.stanford.edu/~jurafsky/slp3/
Schmarzo, B. (2016). Big data MBA. Wiley. https://doi.org/10.1002/9781119238881