| Unit | Equivalent | Approximate meaning |
|---|---|---|
| Gigabyte (GB) | A HD movie file or a few hundred photos | |
| Terabyte (TB) | 1,000 GB | Storage of a modern laptop or external drive |
| Petabyte (PB) | 1,000 TB | Data of a large company or several large data centers |
| Exabyte (EB) | 1,000 PB | Roughly the yearly internet traffic of a small country |
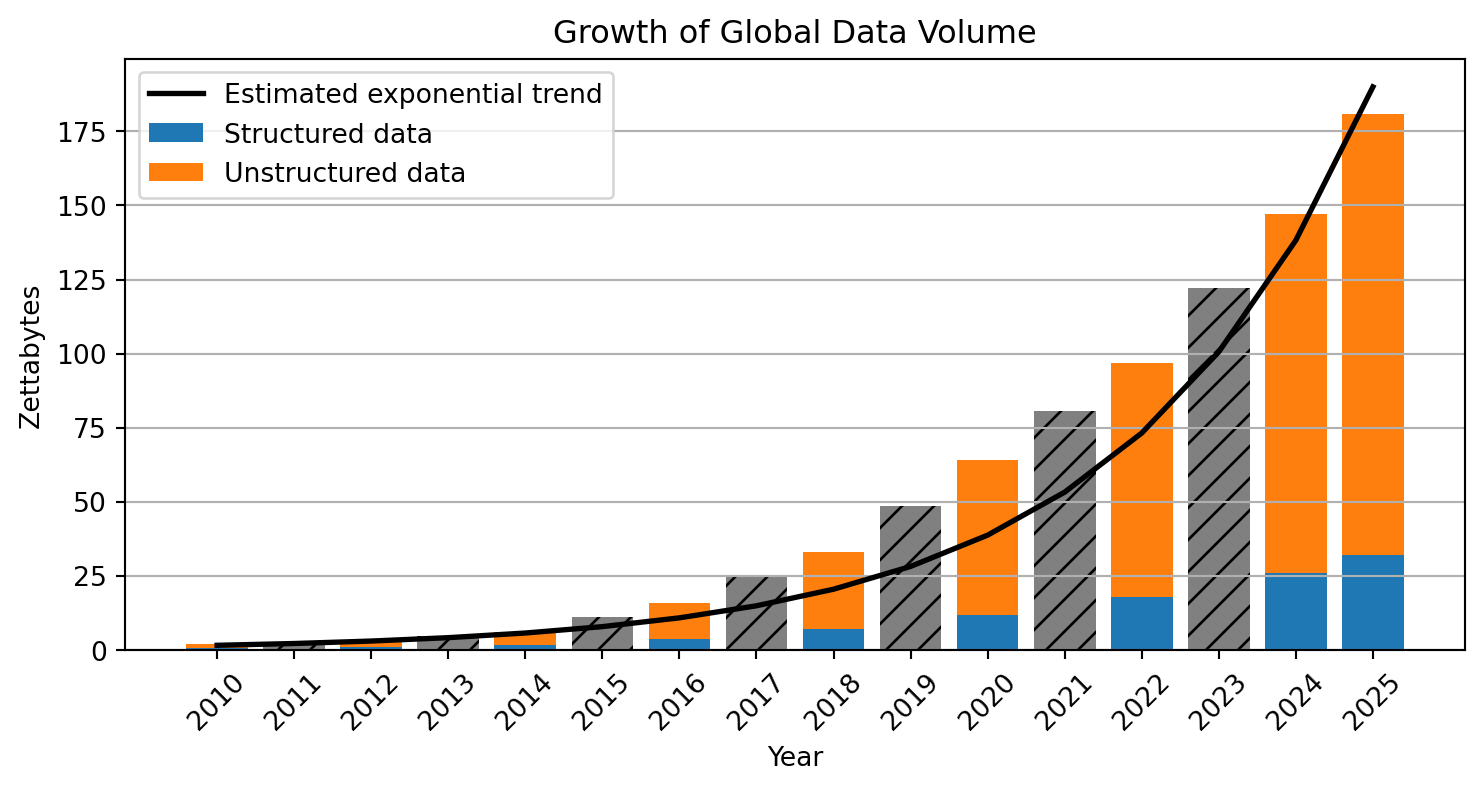
| Zettabyte (ZB) | 1,000 EB | ≈ 1 trillion gigabytes; global data creation scale |
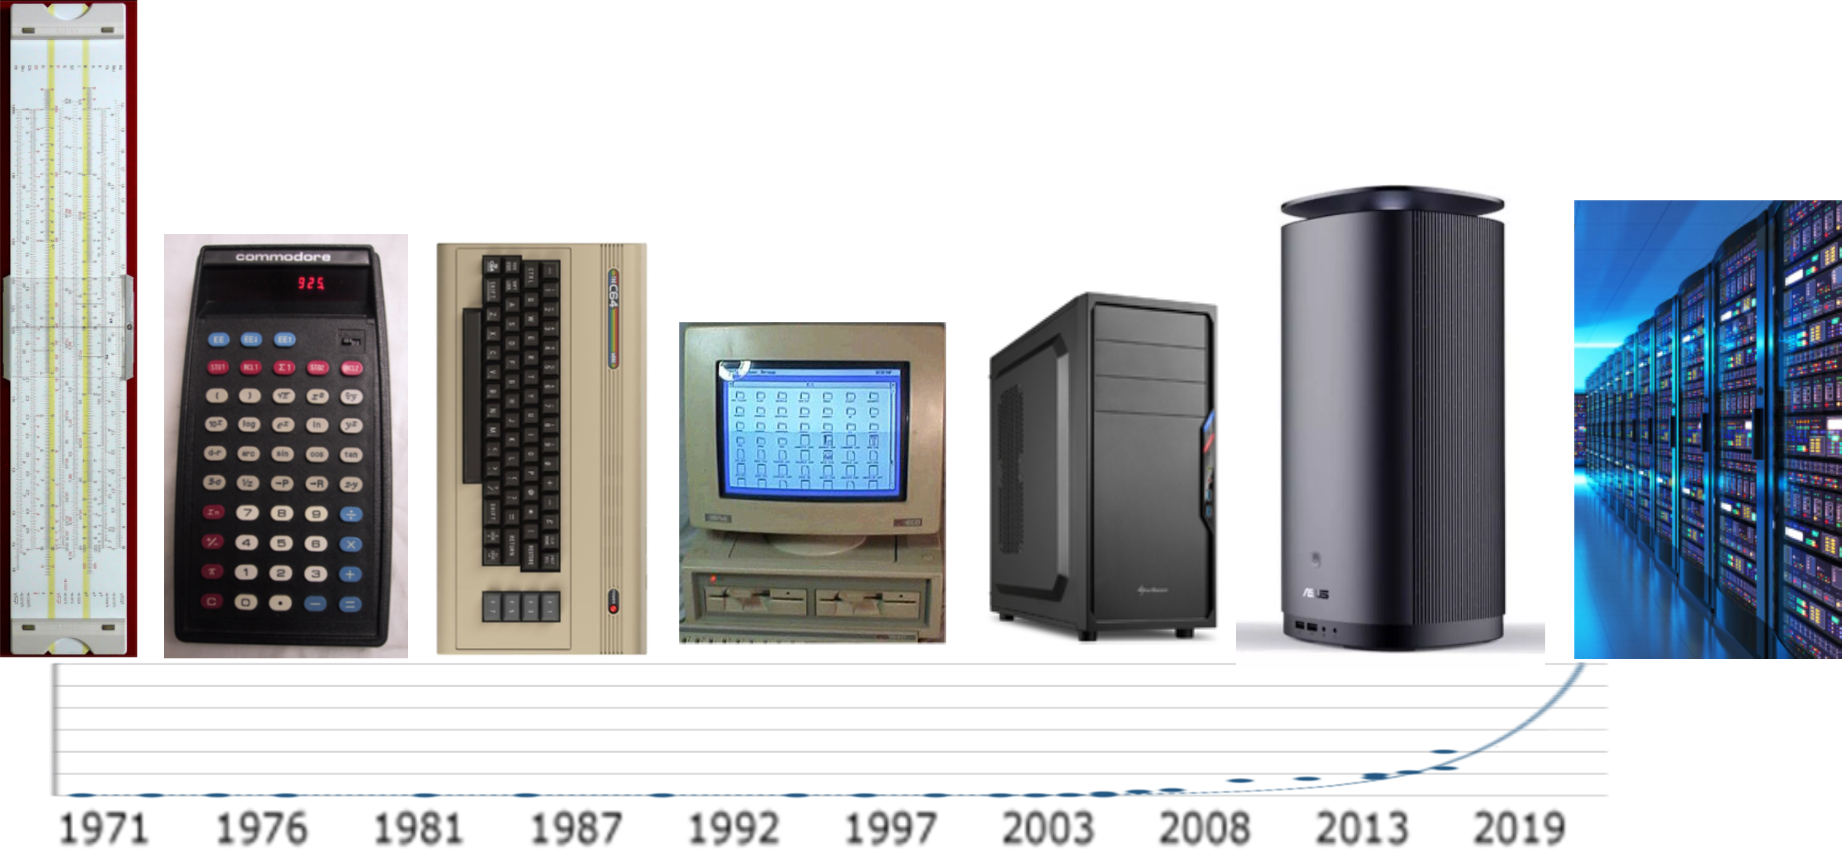
The rapid acceleration of computing power—driven by advances in hardware, cloud infrastructure, and parallel processing—has enabled modern analytics and machine learning to scale to massive datasets.
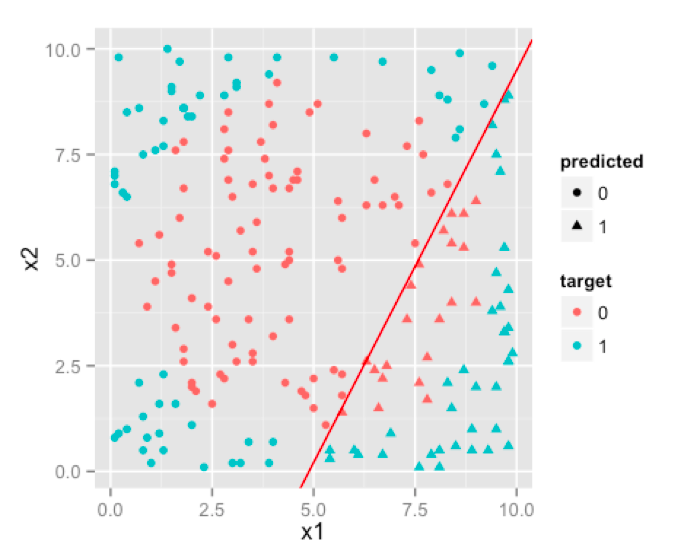
Traditional Regression
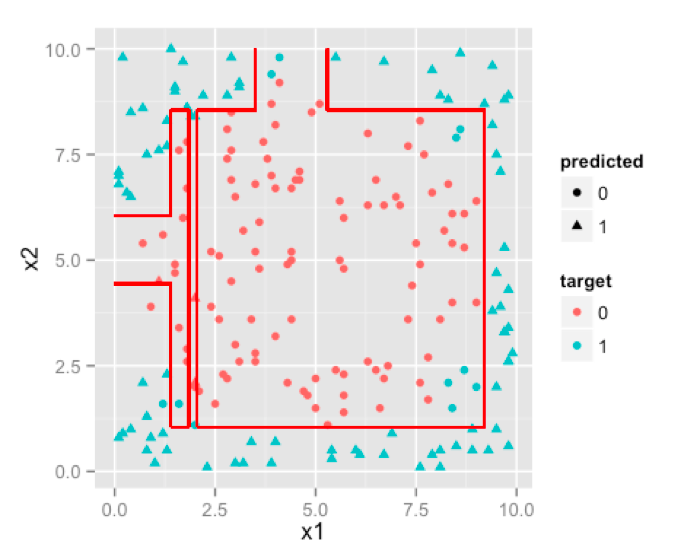
Decision Tree
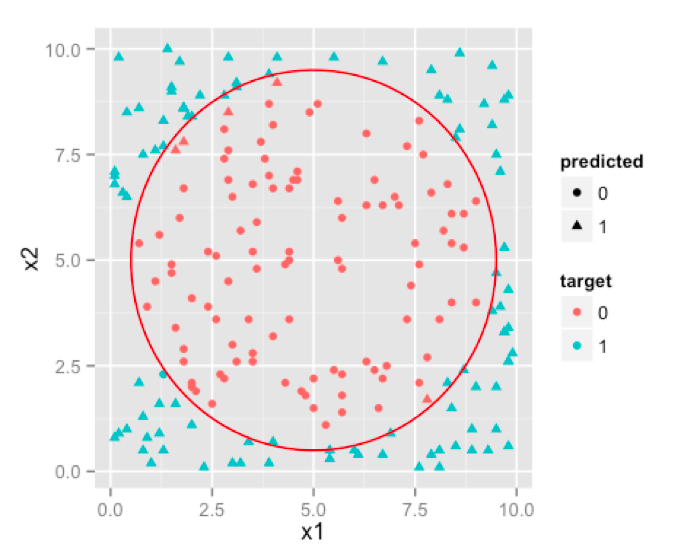
Neural Network
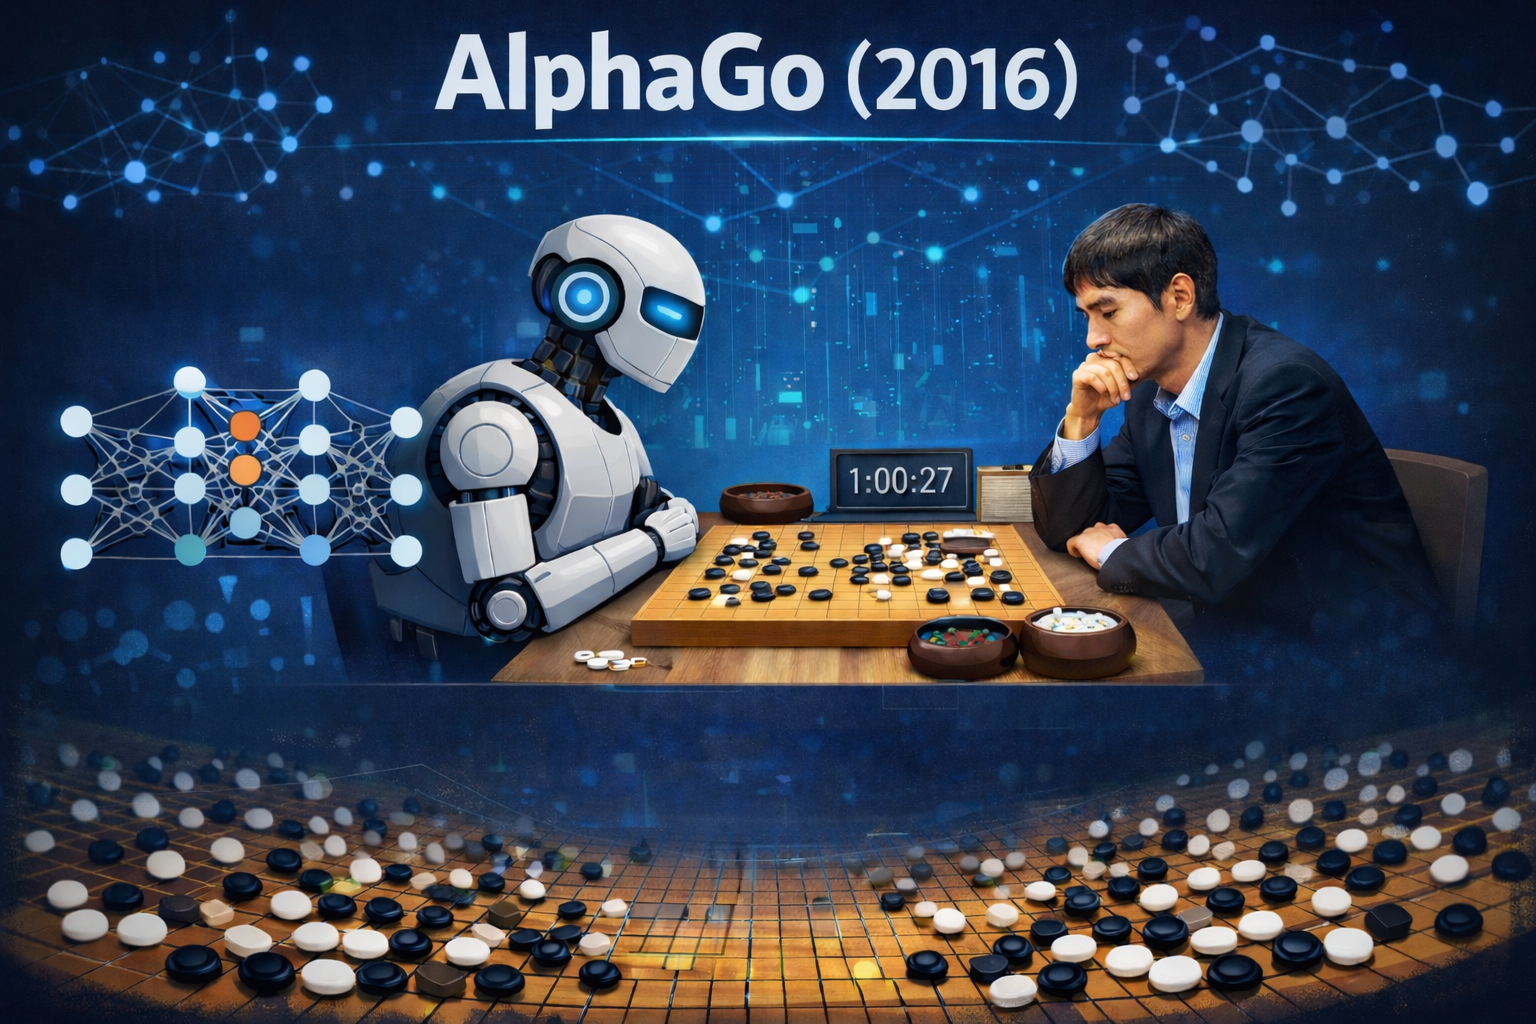
Recent breakthroughs in artificial intelligence (AI)1 show how new algorithms can rapidly surpass human performance. DeepMind provides good examples.
AlphaGo (2016)
Go was long considered too complex for computers due to the enormous search space.
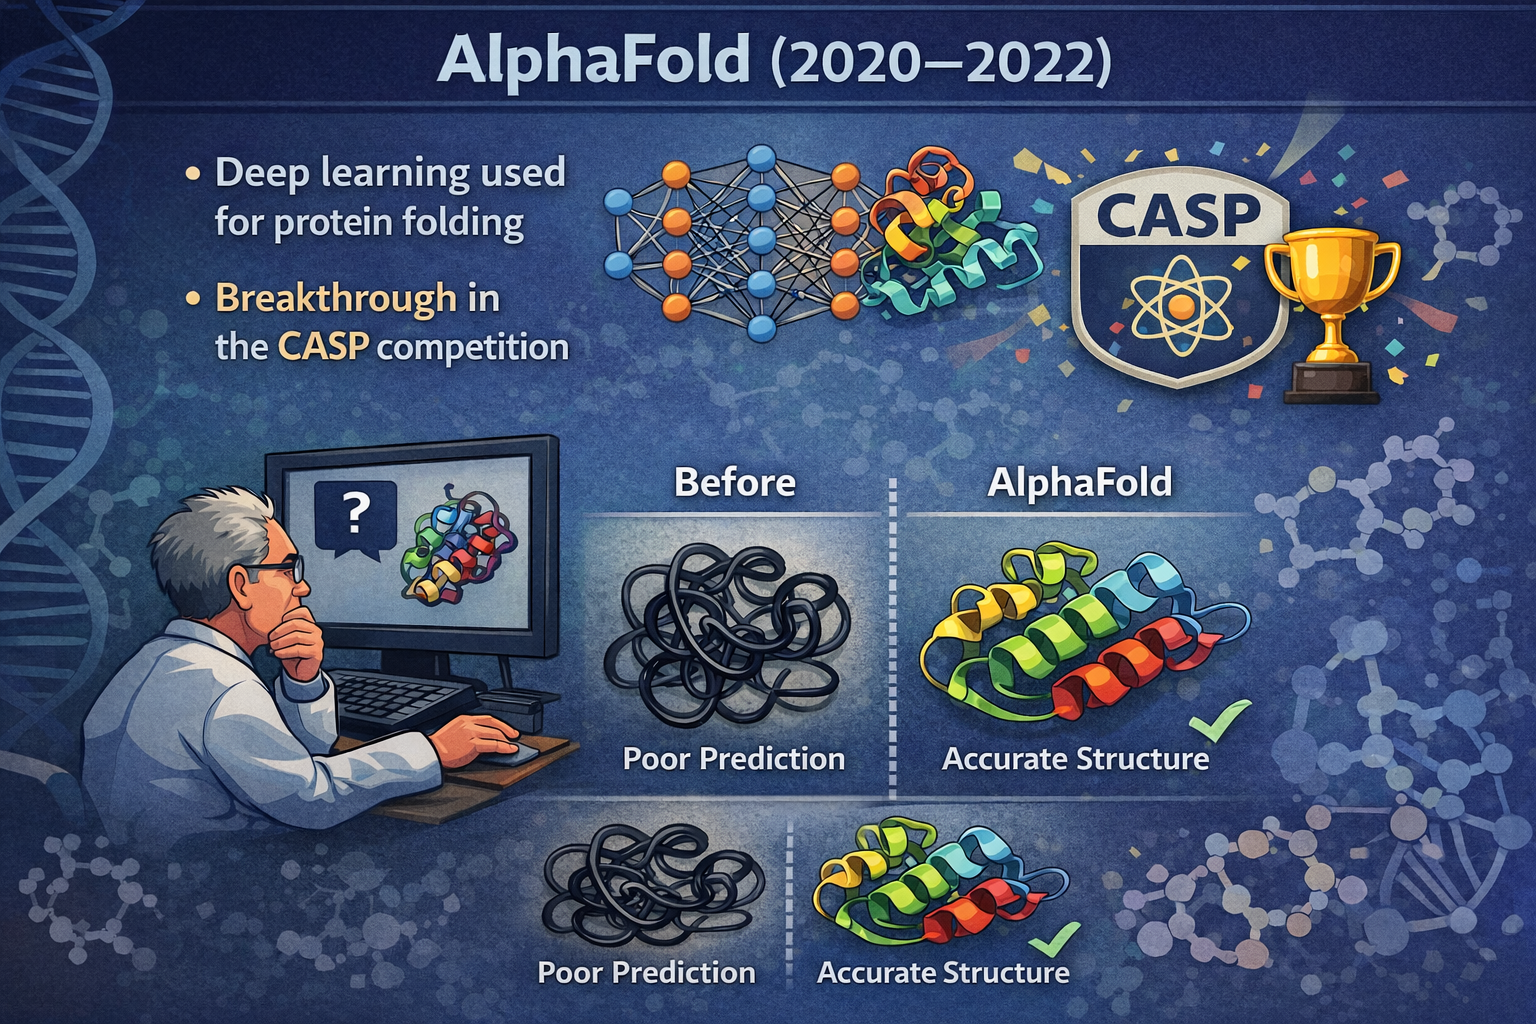
AlphaFold (2020–2022)
Predicting protein folding had been a major unsolved problem in biology for decades.
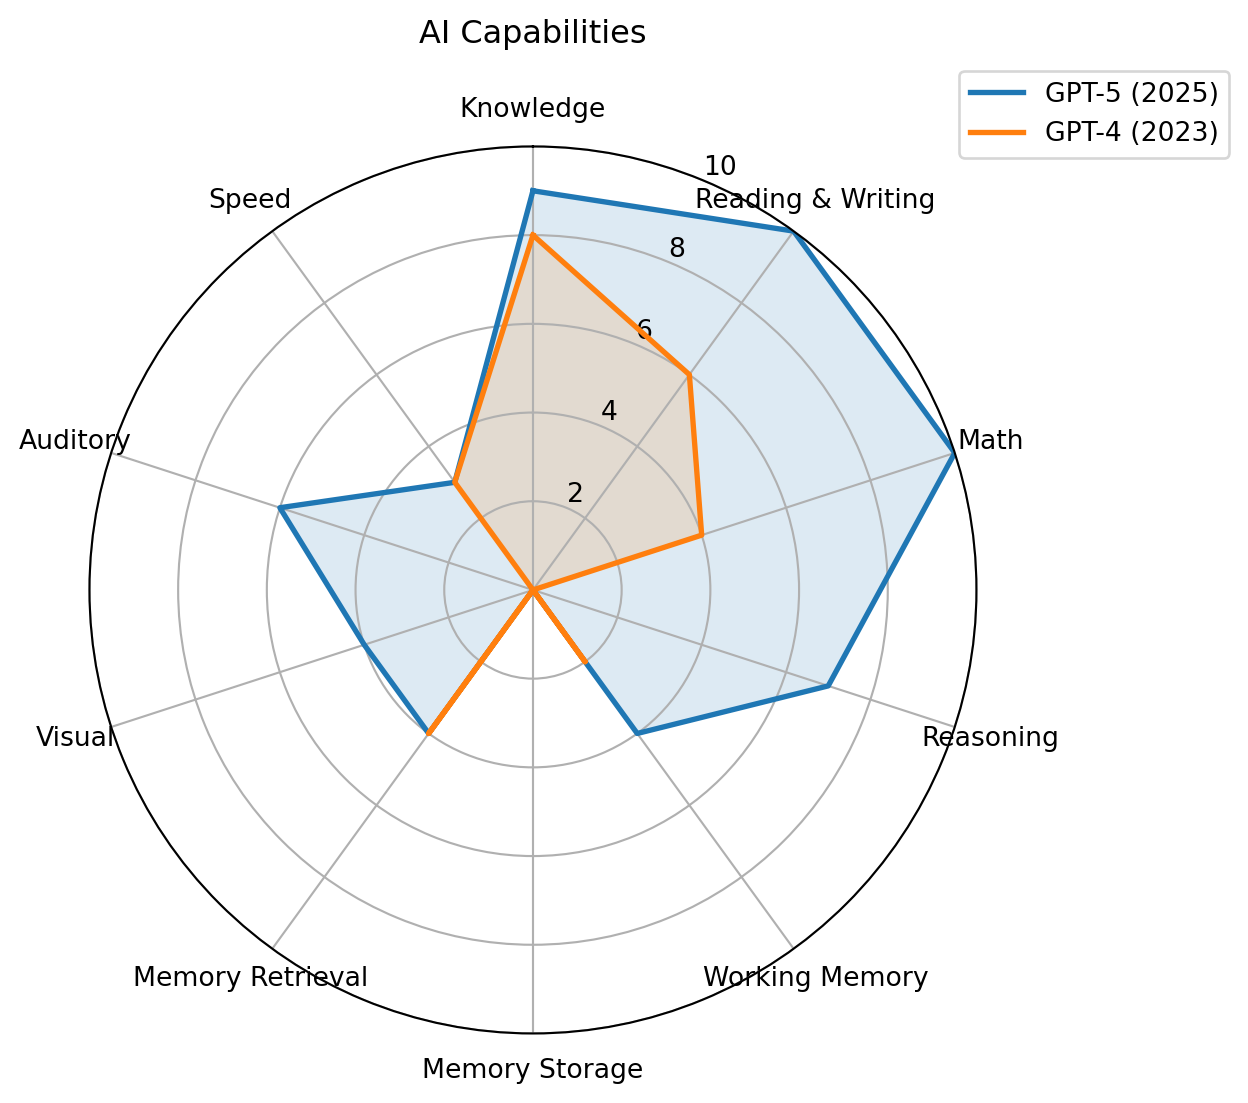
AI progress often occurs through algorithmic breakthroughs, enabling machines to outperform humans in increasingly complex tasks.
Recent studies suggest that AI creates a “jagged frontier.” (Dell’Acqua et al., 2023), i.e., some tasks are well suited to AI, while others that appear similar remain outside its capabilities.
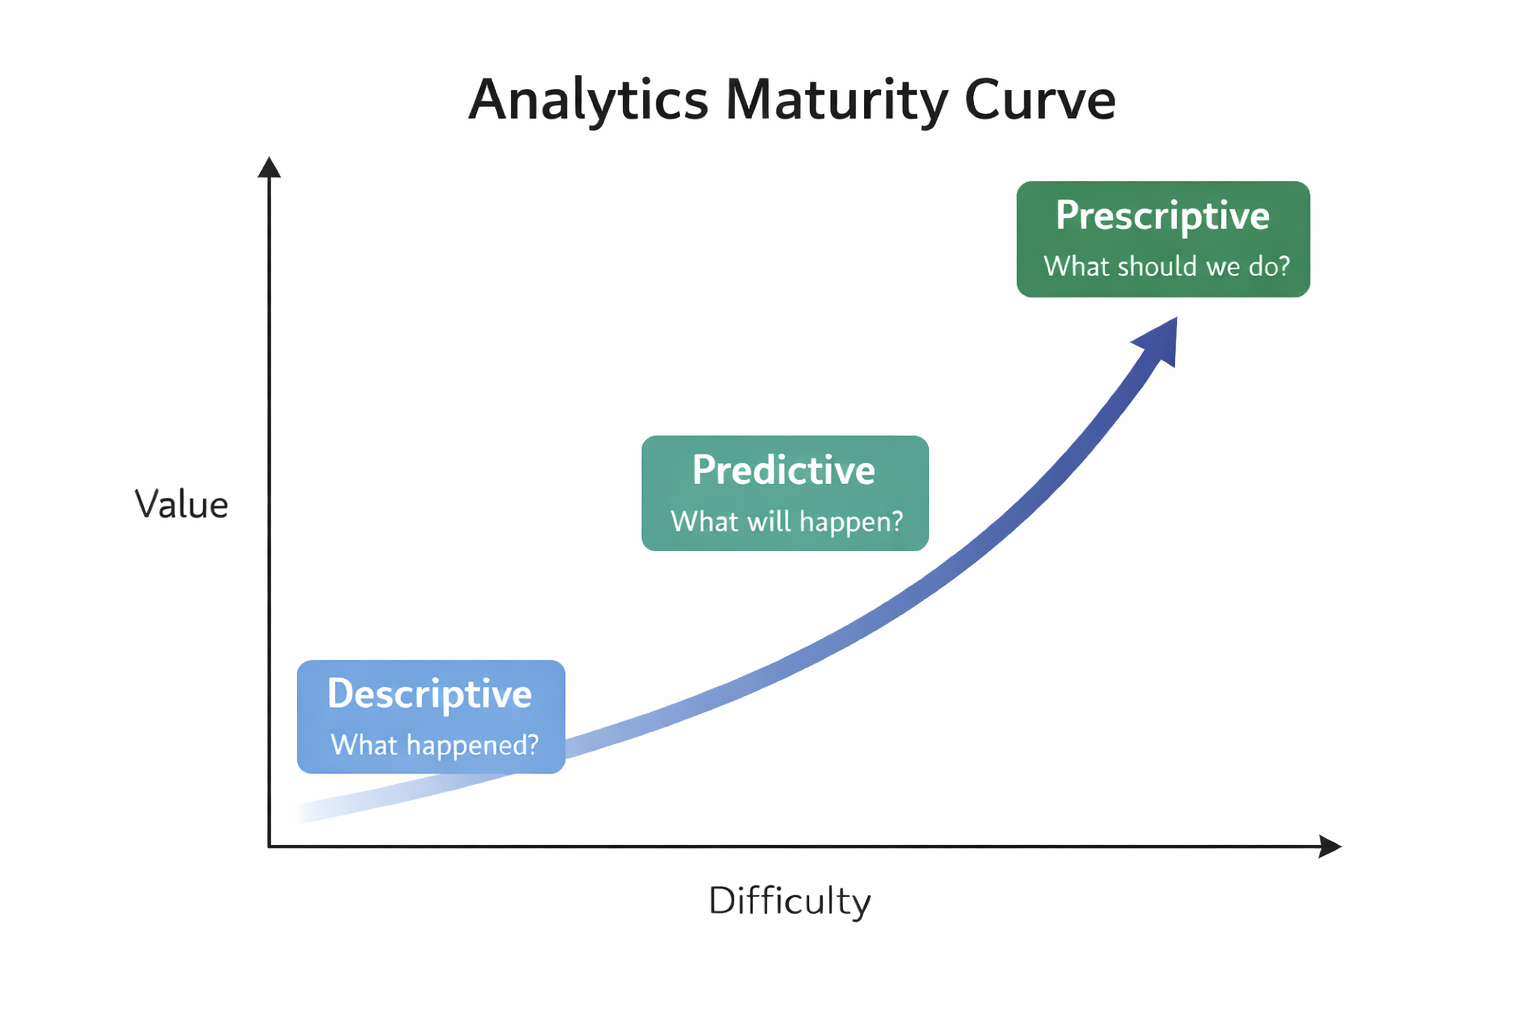
Descriptive analytics: What happened?
Predictive analytics: What will happen?
Prescriptive analytics: What should we do?
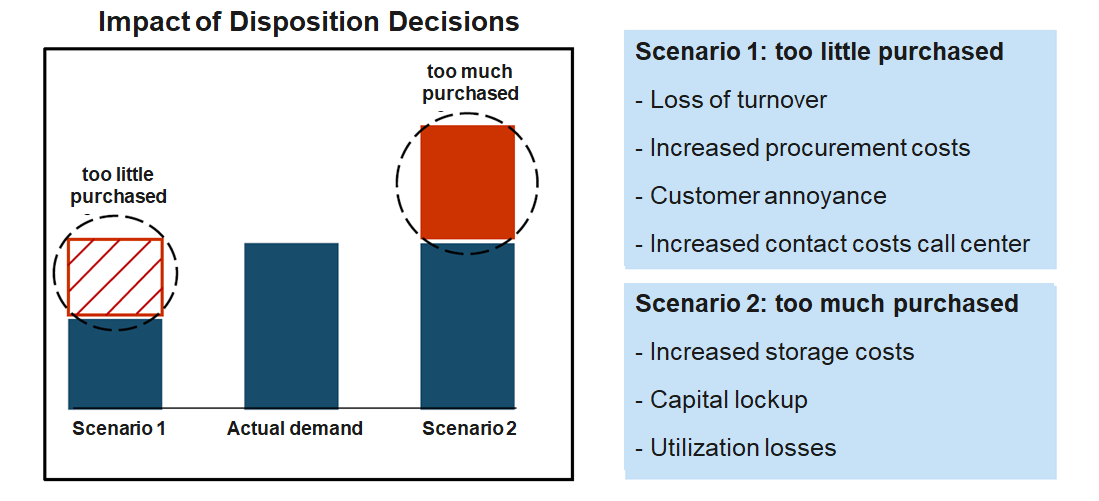
Based on more than 300 million data records per week, Otto generates over one billion forecasts annually on the expected sales of individual products in the coming days and weeks. These forecasts are used to optimize inventory decisions, determining how many units of each product should be stocked or reordered across warehouses. By systematically adjusting inventory levels based on these data-driven recommendations, Otto is able to reduce its overall inventories by up to 30% on average while maintaining product availability.
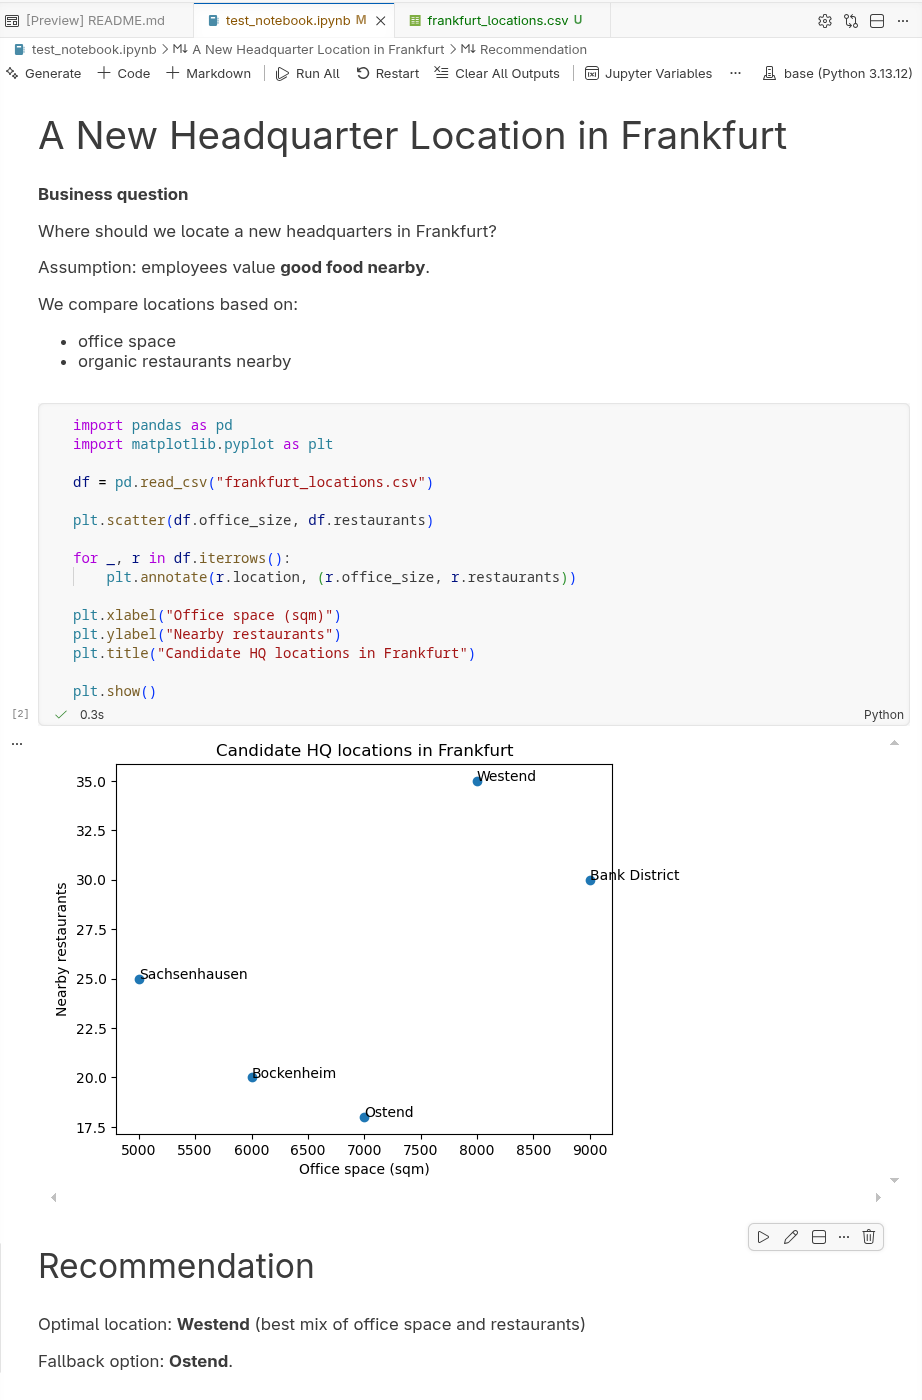
Jupyter Notebooks combine context, code, output, and implications in one interactive document.
Cells
Output
Running a code cell produces results directly below it (text, tables, charts, etc.).
Execution environment
Modes
EnterEscNavigating cells
↑ / ↓a (above) / b (below)Cell types
myRun cells
Ctrl + Enter or Shift + Enter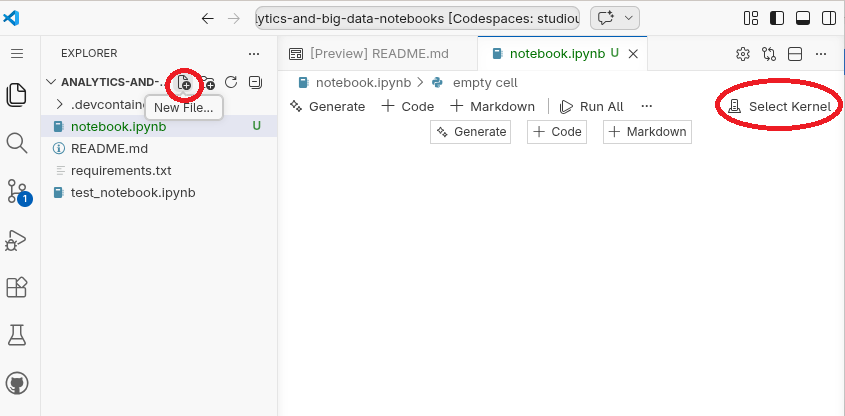
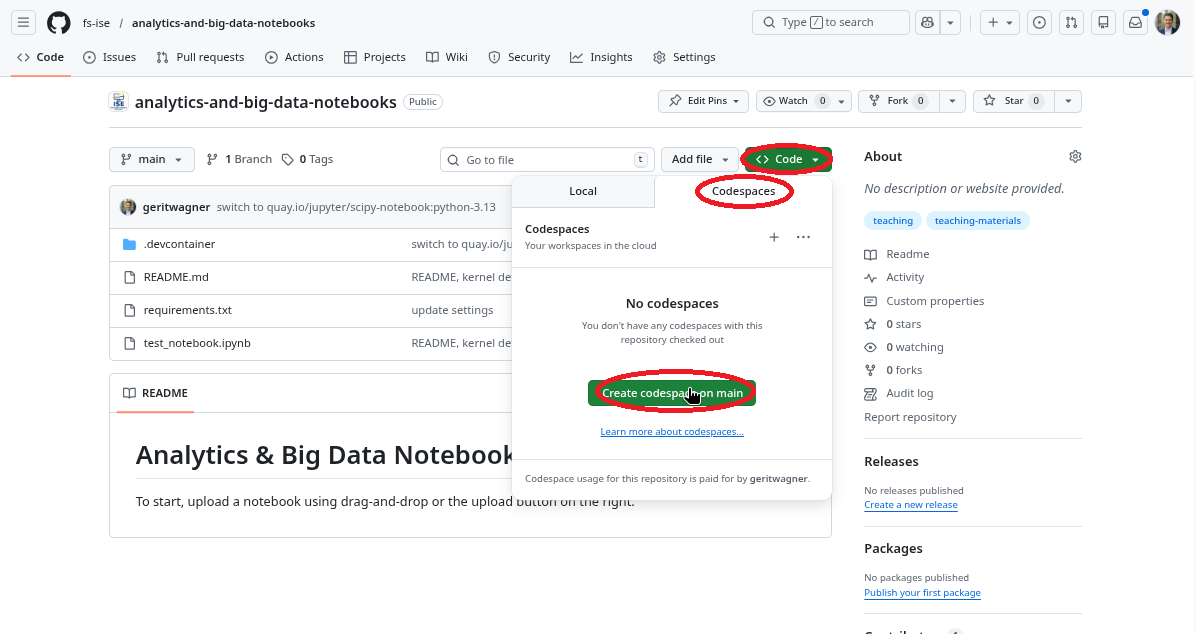
Steps to get started:
notebook.ipynb/opt/conda/bin/python.