Frankfurt School Logo

Analytics & Big Data

Session 10: Analytics in organizations

Prof. Dr. Gerit Wagner

(2026-05-11)


  • Explain the strategic role of data analytics in data-driven organizations.
  • Discuss the ethical and legal boundaries of data analytics in organizations.

Industry-level perspectives

Does the deployment of analytics pay off?

Müller et al. (2018): The Effect of Big Data and Analytics on Firm Performance

The study examines whether firms with live big data and analytics (BDA) assets show higher productivity than comparable firms without such assets.

Empirical setting

  • 814 publicly traded firms
  • 2008–2014 panel data
  • 5,698 firm-year observations
  • Objective data on live BDA assets
  • Financial data from Compustat

Outcome and controls

  • Outcome: \(\log(Sales)\)
  • Inputs: labor, capital, materials
  • Controls: General IT, industry, and year
  • Moderators: IT intensity and competition


\[ \begin{aligned} \log(Sales) =\;& \beta_0 + \beta_1 \log(Labor) + \beta_2 \log(Capital) + \beta_3 \log(Materials) \\ &+ \beta_4 BDA + Controls + \varepsilon \end{aligned} \]

Findings

OLS FE
log(Capital) 0.090***
(0.015)
0.127***
(0.029)
log(Labor) 0.296***
(0.024)
0.472***
(0.043)
log(Materials) 0.667***
(0.023)
0.442***
(0.035)
BDA 0.041**
(0.020)
0.038*
(0.021)
Industry dummies? Yes Yes
Year dummies? Yes Yes
IT Asset dummies? Yes Yes
Observations 5,698 5,698
\(R^2\) 0.977 0.791
Adjusted \(R^2\) 0.977 0.755

Key findings and implications

  • Analytics assets alone are insufficient: value depends on complementary resources such as data infrastructure, enterprise systems, and analytical skills.
  • Industry conditions matter: IT-intensive and highly competitive industries show clearer productivity effects.
  • Causality remains difficult: observational firm-level data can reduce, but not fully eliminate, concerns about reverse causality and omitted variables.

At the industry level, analytics deployment should be understood as part of a broader configuration of digital capabilities, competitive pressure, and organizational capacity to turn data into decisions.

A meta-analysis

Oesterreich et al. (2022): What translates big data into business value?

This meta-analysis examines how differences in business analytics (BA) resources, capabilities, and contextual factors are associated with differences in firm performance.


Empirical setting

  • 125 firm-level studies
  • 123 articles
  • 2012–2021 research period
  • 26 countries, four continents
  • 358 effect sizes
  • Quantitative synthesis through meta-analysis

Meta-analysis results


Independent variable n N Estimated effect 95% CI Heterogeneity
BA technical resources 91 39,246 0.452 0.409–0.493 Q = 1920.153**, df = 90, I² = 95.31%
BA human resources 42 9,219 0.494 0.444–0.541 Q = 379.967**, df = 41, I² = 89.21%
BA management capabilities 69 16,074 0.477 0.433–0.519 Q = 861.169**, df = 68, I² = 92.10%
Data quality 14 3,088 0.434 0.328–0.528 Q = 142.257**, df = 13, I² = 90.86%
Organizational culture 18 3,698 0.472 0.391–0.546 Q = 153.939**, df = 17, I² = 88.96%
External pressure 17 3,644 0.165 0.036–0.288 Q = 248.937**, df = 16, I² = 93.57%


Key findings and implications

  • BA is positively associated with firm performance across studies.
  • The strongest effects are linked to human resources, management capabilities, and organizational culture.
  • Technical resources and data quality matter, but they do not explain value creation alone.
  • External pressure shows a smaller effect.
  • High heterogeneity indicates that BA value creation remains context-dependent.

Organizational perspectives

A process perspective

Kunz et al. (2025): Process-level value creation from business analytics

This theoretical literature review examines how business analytics creates value in organizational processes and how machine learning changes these value-creation paths.

Research focus

  • Process-level value creation
  • Business analytics systems in use
  • Organizational decision-making
  • Knowledge creation and use
  • Effects of ML-based analytics

Method and evidence base

  • Theoretical literature review
  • Emergent theory building
  • 176 articles synthesized
  • Information Value Chain as sensitizing lens
  • Six value-creation paths identified


Business analytics value creation process Data Business Analytics system Information Knowledge Decision Action Value

Value creation paths

Data Business Analytics system Information Knowledge Decision Action Value Other processes Supported process Interrelated decisions Interrelated actions Decision augmentation and automation Knowledge accumulation and transfer Feedback

How machine learning changes value creation

Data Business Analytics system Information Knowledge Decision Action Value Other processes Supported process Interrelated decisions Interrelated actions Decision augmentation and automation Knowledge accumulation and transfer Feedback + + āˆ’ āˆ’ āˆ’
  • Autonomy leads to a stronger reliance on analytical information for decision-making and action
  • Dynamism involves knowledge and data-driven feedback to improve the ground truth or the analytical system
  • Opacity refers to the inscrutability of machine learning models, which restricts human understanding and process improvement

Towards a mature analytics portfolio

The TDWI Analytics Maturity Model offers a diagnostic framework for assessing analytics capabilities across organization, resources, data infrastructure, analytics, and governance.

The model classifies analytics maturity into five stages:

  • Nascent → Early → Established → Mature → Advanced/Visionary

TDWI’s model supports a structured assessment of where an organization’s analytics portfolio currently stands and where further development may be needed.

Data and analytics maturity model Five colored maturity areas with bullet points: organizational, resource, data infrastructure, analytics, and governance maturity. Organizational Maturity • Leadership • Culture • Impact • Strategy Resource Maturity • Funding • Talent/skills • Roles/ responsibilities • Training Data Infrastructure Maturity • Diversity, volume, and speed • Data access • Data integration and management • Data architecture Analytics Maturity • Scope of capabilities • Automation/ augmented • Deployment and delivery approaches • Innovation Governance Maturity • Data governance processes and tooling • Model governance processes and tooling • Governance roles • Security/privacy

Responsible deployment: Analytics and AI risk management

Advanced analytics increasingly becomes part of AI systems when it informs, recommends, or automates consequential decisions.

NIST AI Risk Management Framework

  • Govern: roles, policies, accountability
  • Map: context, stakeholders, intended use
  • Measure: performance, bias, robustness, risks
  • Manage: mitigation, monitoring, incident response

Deployment questions

  • Who is affected?
  • What decision is supported or automated?
  • What can go wrong?
  • Who is accountable?
  • How do we know when to stop or intervene?

The GDPR (Art. 15 and 22) and the AI Act (Art. 27 and 86) require organizations to support responsible use of consequential automated decisions: affected persons need meaningful information, human intervention and contestability, while deployers of high-risk AI systems need transparency, oversight, logging, and fundamental-rights assessments.

Boundaries: what should not be optimized?

Analytics creates value only within legitimate organizational, ethical, and legal boundaries.


Possible boundaries

  • Privacy and purpose limitation
  • Non-discrimination and fairness
  • Safety and reliability
  • Human autonomy and dignity
  • Legal compliance
  • Organizational values

Examples

Use case Boundary question
Employee analytics Does this become surveillance?
Credit scoring Who is disadvantaged?
Medical triage What happens in edge cases?
Dynamic pricing When is personalization exploitative?
Fraud detection How are false positives handled?

The black box of modern analytics

Modern analytics systems transform data into predictions without exposing a decision logic that people can easily inspect.

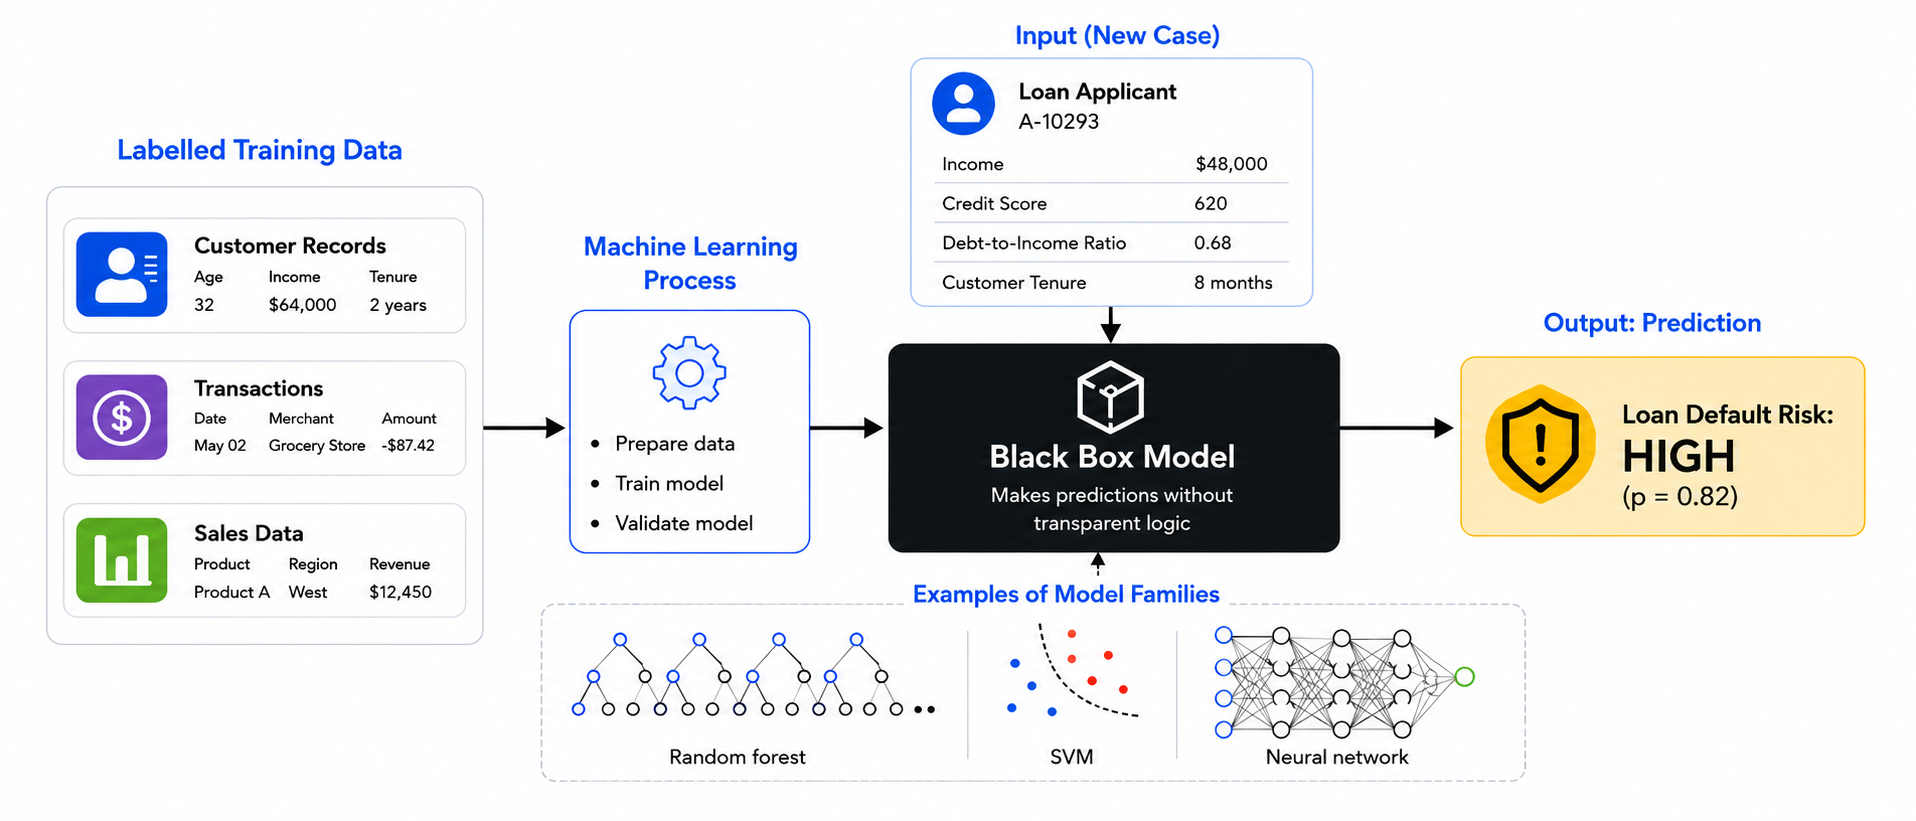
This raises practical questions:

  • Why this prediction?
  • Why not another prediction?
  • When does the system fail?
  • Who can contest or override it?

The need for interpretability


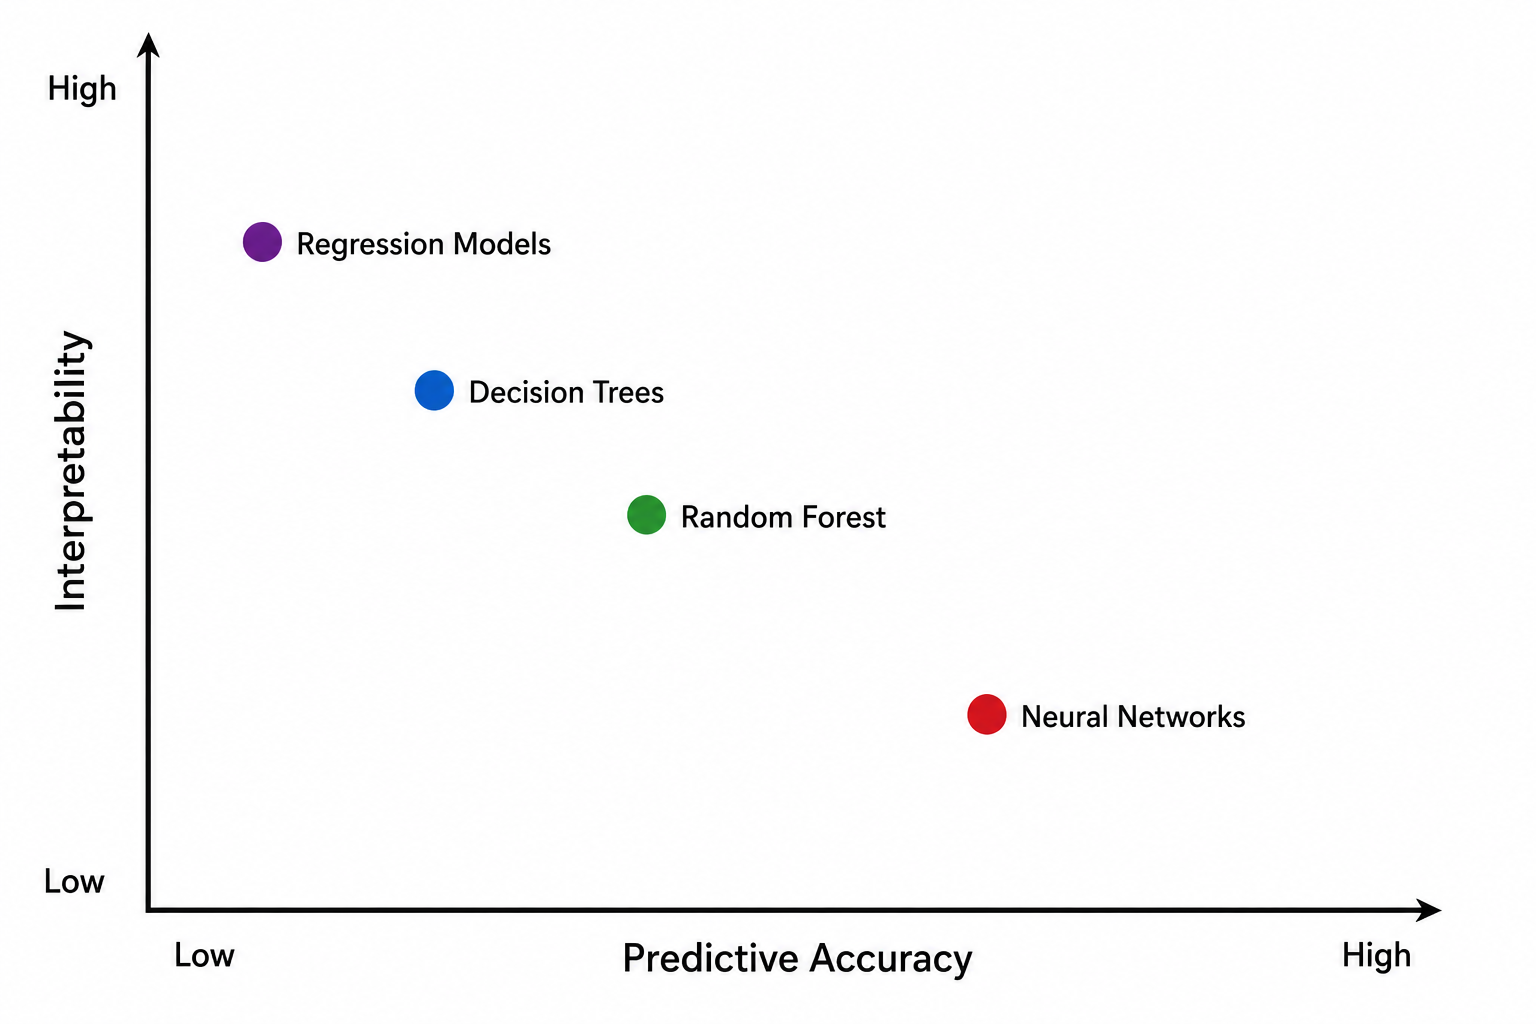
Interpretability is needed for different purposes

Context Purpose
Trust know when to rely on the output
Engineering debug errors, bias, and brittle behavior
Governance assign responsibility and define oversight
Recourse understand, challenge, or improve an outcome
Regulation document compliance and enable auditability

Explainability methods

Explainability methods aim to make AI-based systems, their reasoning processes, or their outputs understandable, either by designing models that are explainable from the outset or by generating explanations for already-trained, potentially opaque models.
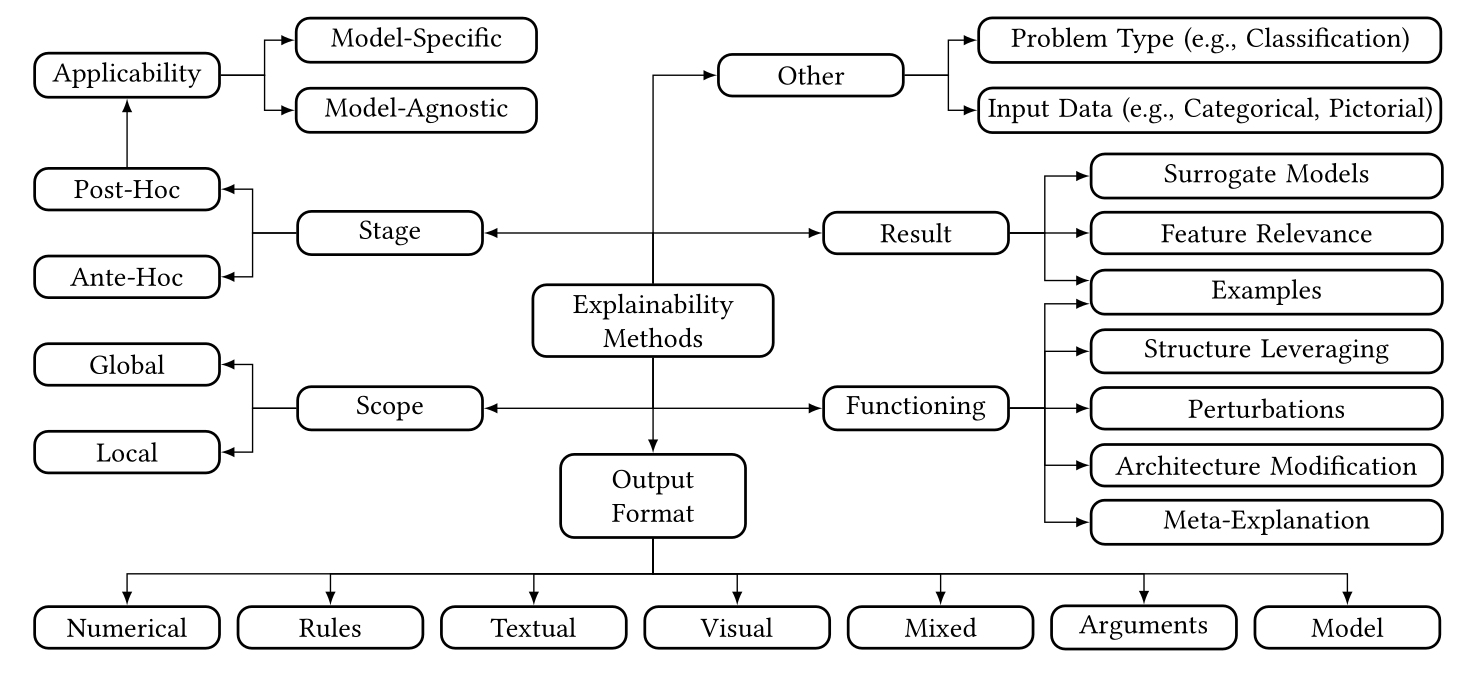
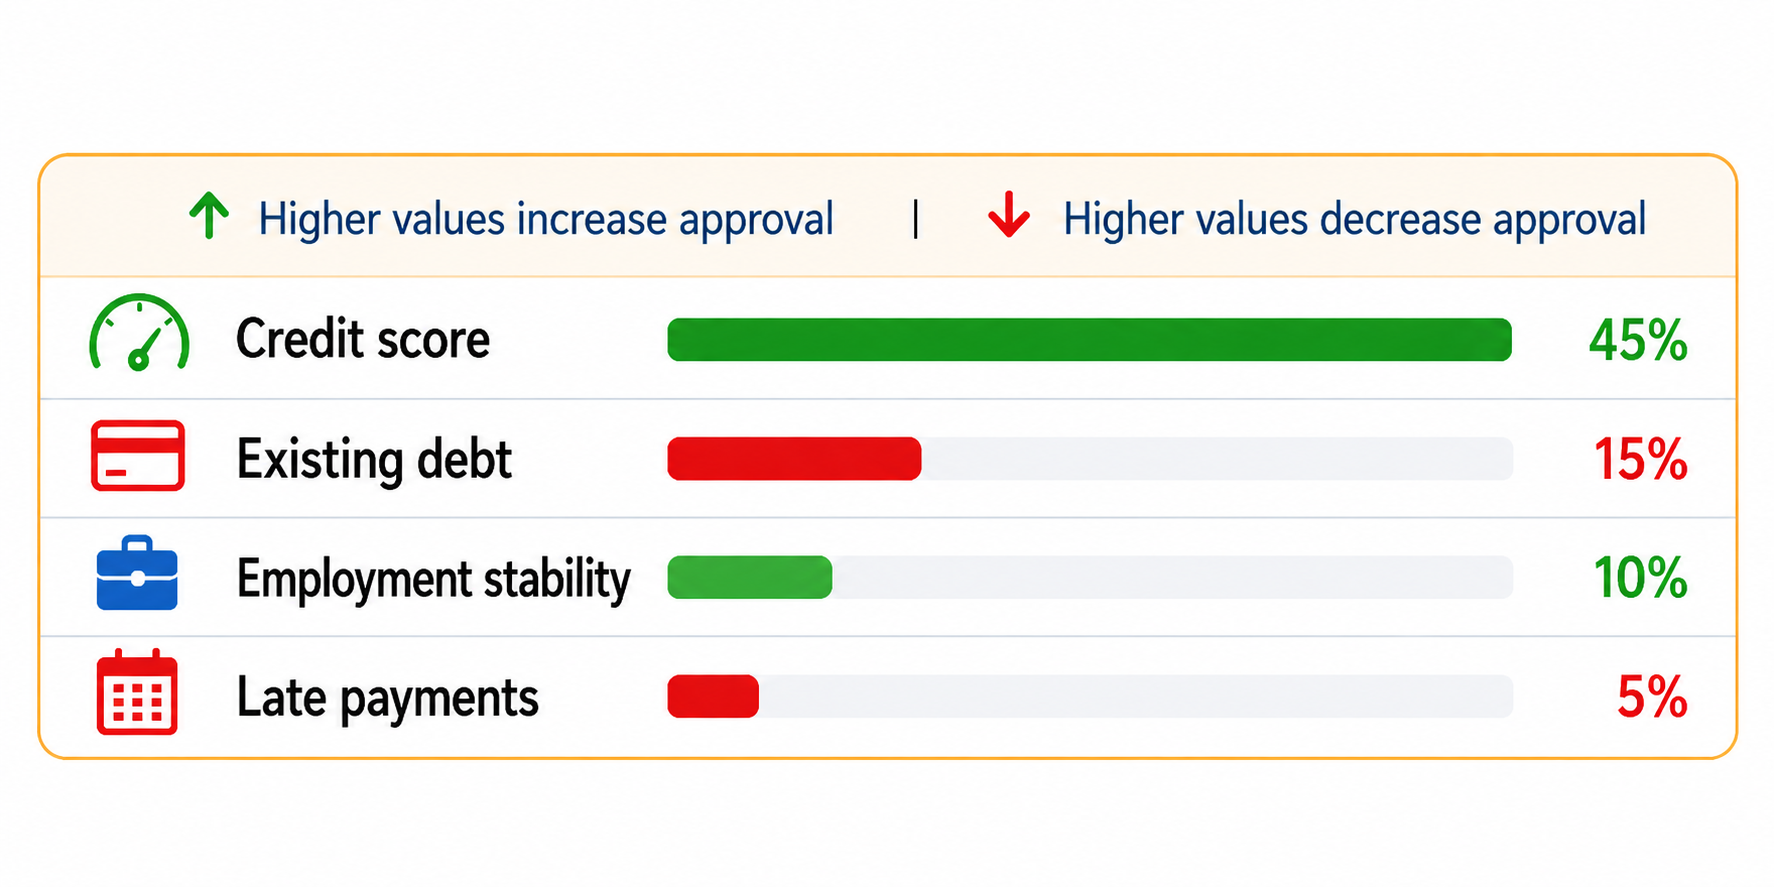

Explainability methods: Examples

Feature importance

Mostly static analysis of the trained model and data; often post-hoc, though some models provide importance intrinsically. Usually provides a global view: which variables matter most across the model or dataset.


Counterfactual explanations

Post-hoc explanation based on minimal feature changes that would alter the prediction.


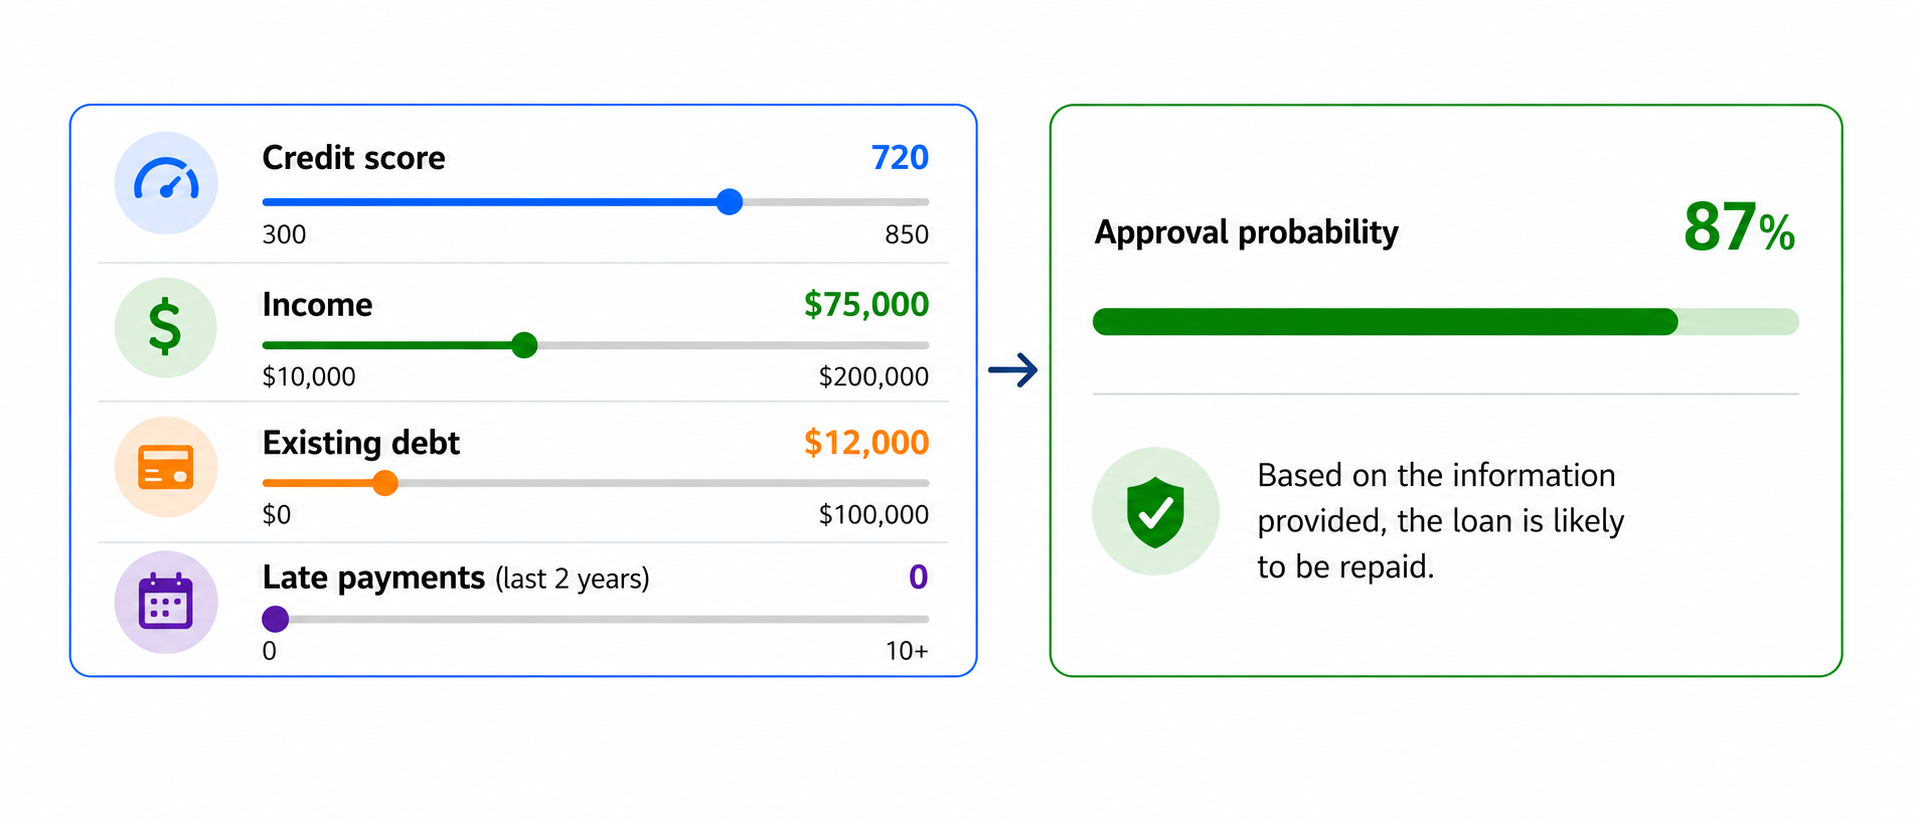
Interactive explanation

Post-hoc, user-driven exploration combining static explanations with what-if changes to input features.

People perspectives

Human resources for analytics

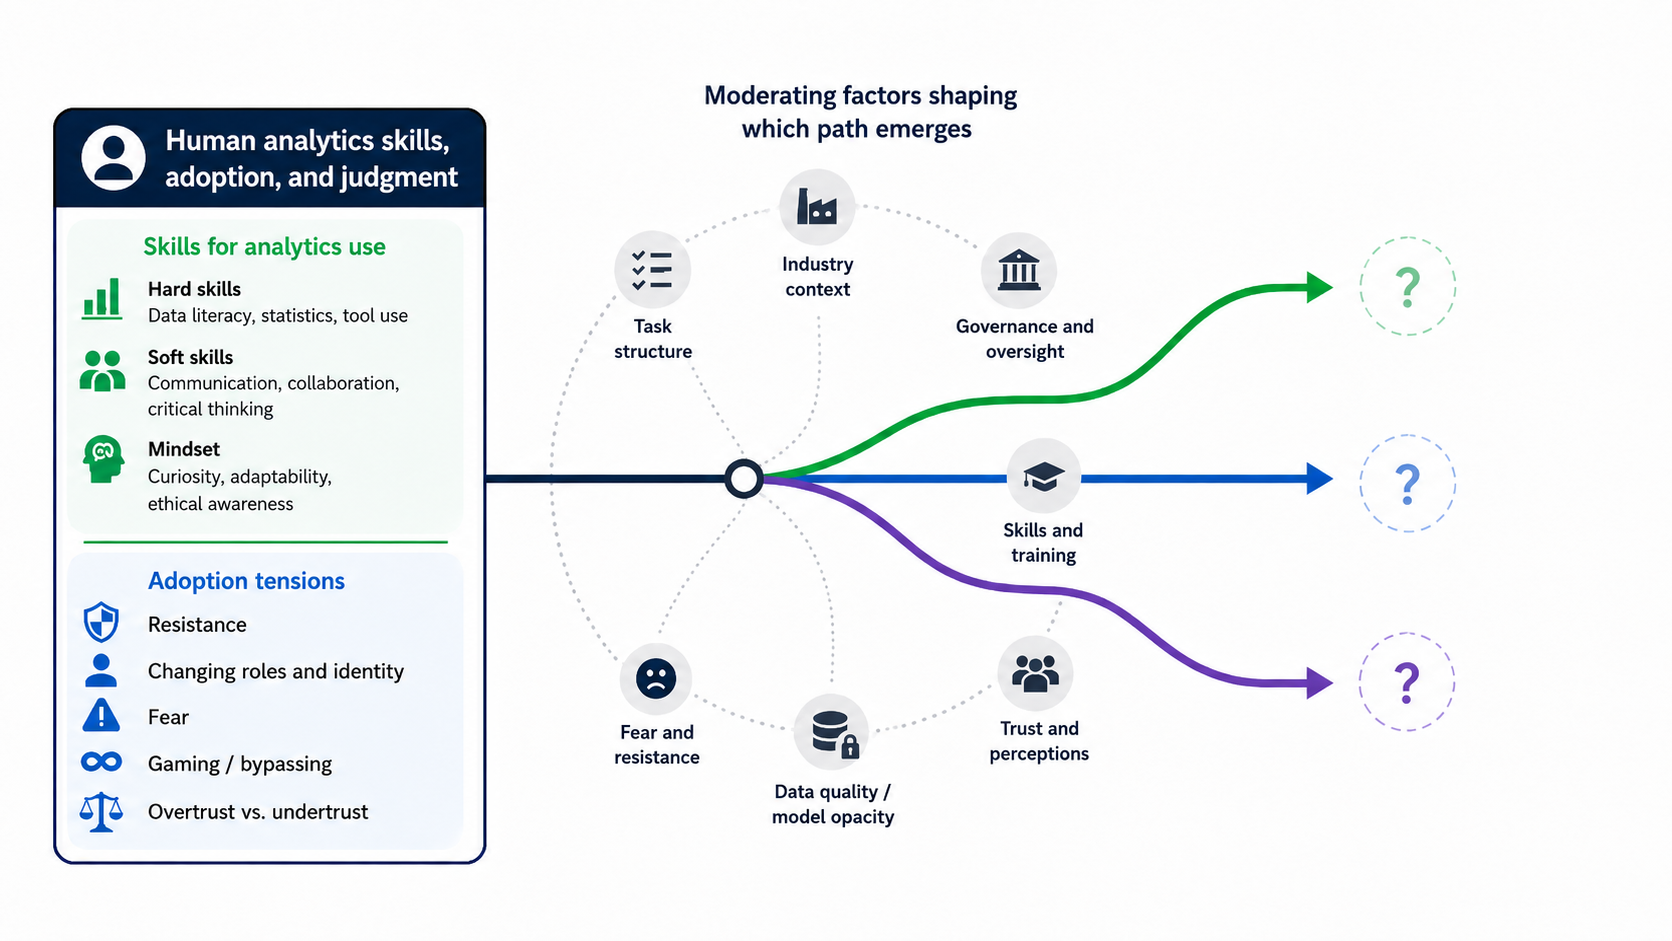
BCG AI Radar 2025 survey

  • 1,803 C-level executives
  • Across markets, industries, roles, and company sizes

Main finding:
AI is expected to reshape work more than eliminate workers.

  • Only 7% expect fewer FTEs due to automation
  • 17% expect workforce restructuring with new roles
  • 68% expect more productivity and upskilling of the existing workforce
  • 8% expect more FTEs and new skills

Analytics and AI deployment is a people-and-process transformation: executives expect value to come from humans and AI working side by side, with human oversight remaining central.

Possible human futures in analytics and AI

Summary

  • Analytics can improve organizational performance, but its value depends on context, complementary resources, and how analytics is embedded in organizational processes.

  • Value creation requires an analytics portfolio that combines data infrastructure, technical and human resources, management capabilities, and governance aligned with strategy.

  • Responsible deployment means asking not only ā€œCan we optimize this?ā€ but also ā€œShould we?ā€ — defining ethical, legal, and organizational boundaries before systems go live.

  • As analytics becomes more autonomous, dynamic, and opaque, organizations need interpretability, risk management, and oversight mechanisms that allow people to understand, contest, and intervene.

  • The human role is changing rather than disappearing: analytics and AI create value when people have the skills, mindset, and organizational conditions to work effectively with them.

Survey: Session 10


https://forms.gle/Rhr4C47jsAZJyumN6

References

Apotheker, J., Duranton, S., Lukic, V., Bellefonds, N. de, Iyer, S., Bouffault, O., & Laubier, R. de. (2025). From potential to profit: Closing the AI impact gap: BCG AI radar. Boston Consulting Group. https://www.bcg.com/publications/2025/closing-the-ai-impact-gap
Burrell, J. (2016). How the machine ā€œthinksā€: Understanding opacity in machine learning algorithms. Big Data & Society, 3(1), 2053951715622512. https://doi.org/10.1177/205395171562251
Chamola, V., Hassija, V., Sulthana, A. R., Ghosh, D., Dhingra, D., & Sikdar, B. (2023). A review of trustworthy and explainable artificial intelligence (XAI). IEEE Access, 11, 78994–79015. https://doi.org/10.1109/ACCESS.2023.3294569
Halper, F. (2020). TDWI Analytics Maturity Model Assessment Guide. TDWI Research. https://go.tdwi.org/rs/626-EMC-557/images/TDWI_Analytics-Maturity-Model-Assessment-Guide_2020.pdf
Kunz, P. C., Spohrer, K., & Heinzl, A. (2025). Process-level value creation from business analytics: A theoretical literature review of value creation paths and changes induced by machine learning. The Journal of Strategic Information Systems, 34(2), 101902. https://doi.org/10.1016/j.jsis.2025.101902
Müller, O., Fay, M., & Vom Brocke, J. (2018). The effect of big data and analytics on firm performance: An econometric analysis considering industry characteristics. Journal of Management Information Systems, 35(2), 488–509. https://doi.org/10.1080/07421222.2018.1451955
Oesterreich, T. D., Anton, E., & Teuteberg, F. (2022). What translates big data into business value? A meta-analysis of the impacts of business analytics on firm performance. Information & Management, 59(6), 103685. https://doi.org/10.1016/j.im.2022.103685
Speith, T. (2022). A review of taxonomies of explainable artificial intelligence (XAI) methods. Proceedings of the 2022 ACM Conference on Fairness, Accountability, and Transparency, 2239–2250. https://doi.org/10.1145/3531146.3534639